Get in Touch with Didi Land


Updated June 2026 · Reviewed by the Guangzhou Didi Land Amusement Equipment Co., Ltd. technical team
Are indoor playgrounds profitable? Indoor playgrounds are profitable businesses when their admissions, parties, and food sales clear rent, labor, and debt with margin to spare, and money-losers when those costs run too high — and the data shows both outcomes are common. Often the answer is yes, but only when the math works, and the math is rarely what the brochures suggest. When the numbers pencil out an indoor playground can be very profitable; when they do not, no amount of fun fixes it. Roughly one in five new businesses fails in its first year, and amusement and recreation ranks among the more failure-prone industries. Rather than focus on inspirational tales, we’re delivering you the indoor playground Profit Formula, a nine-input ROI calculator, and the break-even analysis so you can do your own indoor playground and family entertainment center projections before signing the lease and sending off that first business plan.
Quick Specs: Indoor Playground ROI at a Glance (2026)
| EBITDA margin (operating) | 15–28% at a stabilized site |
| True net margin (after debt + owner pay) | low single digits; negative in the early ramp |
| Owner take-home (stabilized) | ~$90,000–$500,000/yr by scale |
| Payback on capital | ~18–36 months; aim under 24 |
| All-in startup capital | ~$150,000–$500,000+ fit-out |
| Profit stabilizes | Year 2–3 (Year 1 is usually a ramp) |
Are Indoor Playgrounds Profitable? The Short Answer
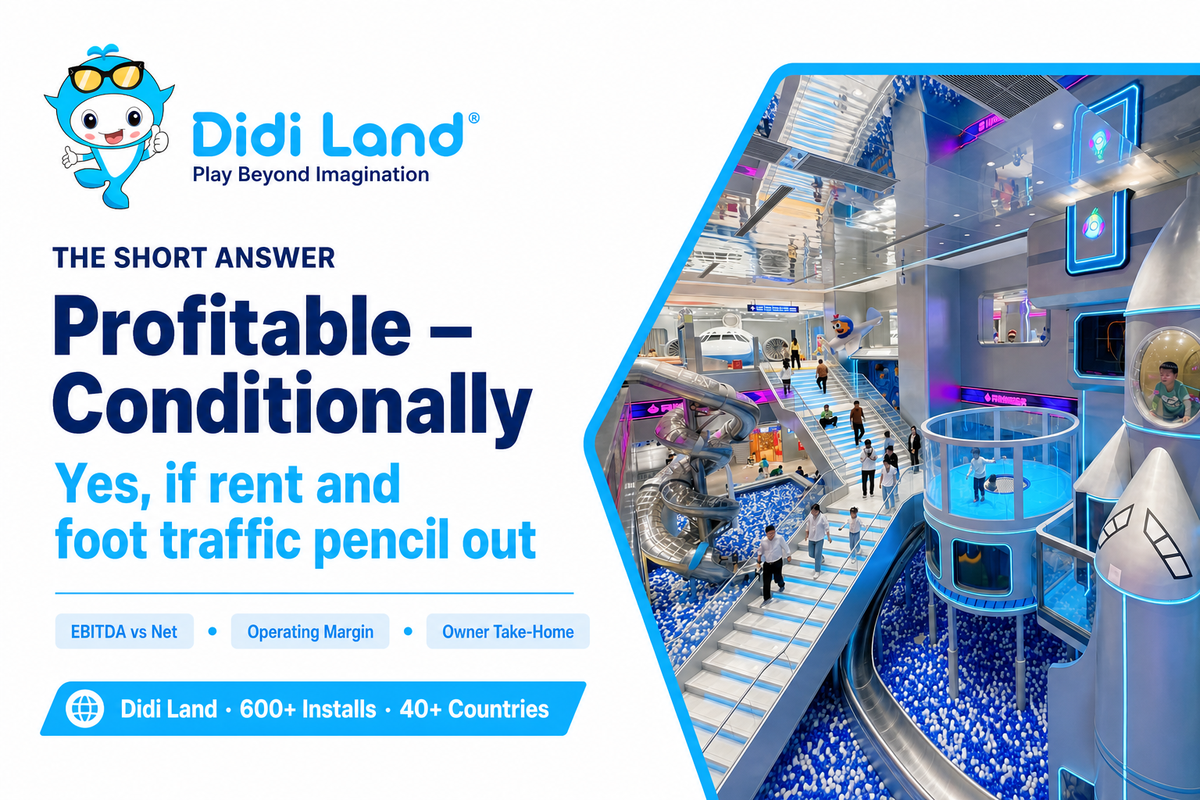
Sort of-but it depends on how you calculate profit, and many operators miss a key step. A stable and well-run indoor playground can yield 15%-28% operating-that’s, EBITDA (Earnings Before Interest, Taxes, Depreciation, and Amortization)-margin, and indoor playground business proprietors of these spaces might even walk away with $90,000 to $500,000 annually depending on size. But these are the success stories. Too many indoor playground entrepreneurs never attain that level of operating success; the difference almost never comes down to whether your equipment or theme was a hit, but to whether the rent and daily foot traffic pencil out in advance. Get that deal wrong, and not even the best bounce houses will save your spreadsheet. It’s just as important to know how much it will cost to open an indoor playground as it’s to understand if that location will remain a profitable indoor play over the course of several age groups.
Watch out for those round, headline numbers, though. A “10%-20% profit margin” is frequently published through out industry press, and almost all the time this refers to your operating profit or EBITDA margins only. Take debt payments, for example, the Depreciation account, and a reasonably modest salary (your take-home salary if your indoor playground could pay the bills) and a real accounting Net Profit, the bottom line after all accounting costs are subtracted from gross revenues, is generally quite different from EBITDA. The NYU Stern 2026 industry margins report (an index of public company filings in the broad “Recreation” sector, not an exact analogue for your new indoor playground) shows companies reporting EBITDA margins near 16.64% but a net margin of about −4.72% across 49 firms — profitable from a cash perspective at the operating line, but net losses on the accounting ledger. This gap between operating margin and true net profit is the single largest source of misunderstanding among prospective owners, and the content below works to lay it bare. For the broader picture — startup-cost details, revenue-stream options, and the most common indoor playground failure modes — see that full ROI guide; here we focus on the math you can run yourself.
The Indoor Playground Profit Formula
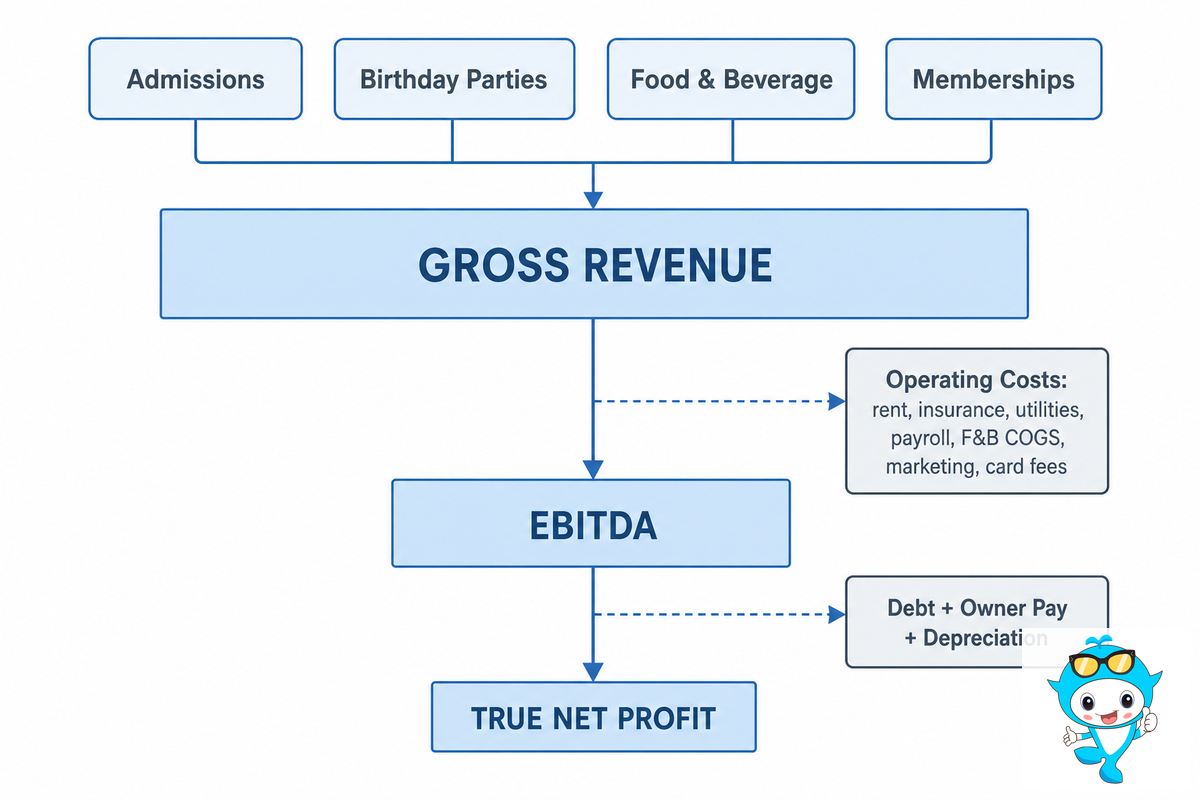
Every profitable indoor playground operates with the same core principles of arithmetic and accounting. Assign a label (or variables) to each account of your profit and loss (P&L) statement and this page is plug-and-play — use it as your own Indoor Playground Profit Formula. Note that the model has three layers, not just one:
Gross Revenue= Admissions + birthday parties + Food & Beverage + Memberships
Monthly EBITDA= Gross Revenue – Operating Costs(where operating costs are: Rent+ insurance+ utilities/HVAC+ payroll+ F&B COGS+ marketing+ card fees & consumables).
True Net Profit= EBITDA- Debt Payments- Owner’s Compensation- Depreciation.
Most owners fool themselves on line three of this sheet – EBITDA. This is the number that look great in a pitch deck, the number that ignores the bank loan that bought the playground, the wear and tear on the equipment, and the salary you would need to hire a manager — US amusement and recreation staff earn a median wage in the low teens per hour per the BLS — none of which factor in. Your site might have healthy EBITDA and little if anything left for you after the lease, loan, staff, etc. in year one.
Worked once, end to end, for a stabilized mid-size site grossing about $57,000 a month: revenue $57,000 − operating costs $44,500 = $12,500 monthly EBITDA (a 22% operating margin, ~$150,000/yr). Then subtract a $3,500 loan payment, a $4,000 owner salary, and ~$2,500 of depreciation, and true net lands near $2,500/monthabout a 4% accounting margin. The same business that “makes 22%” also “makes 4%.” Both are true; they answer different questions.
What Real Indoor Playgrounds Gross & Net: 2026 Earnings Benchmarks
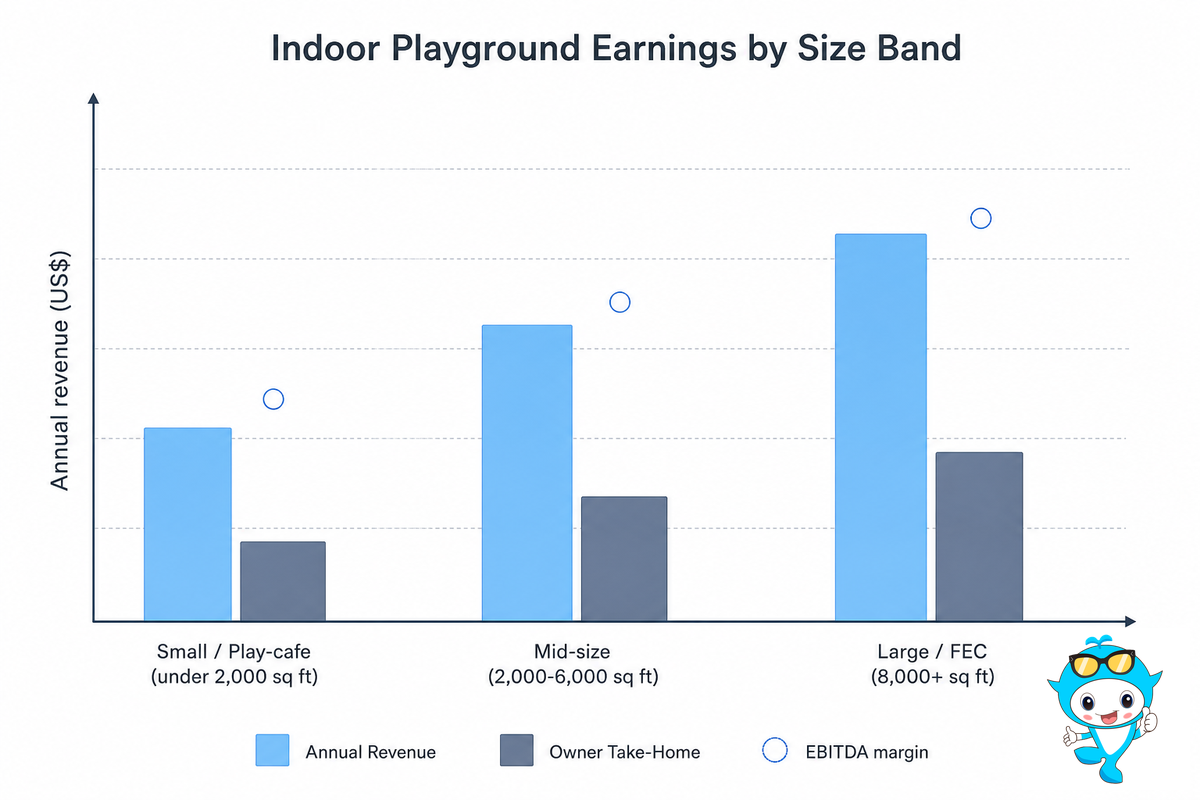
Revenue scales roughly with active play area, but margin does not scale the same way: a bigger site can gross more and still net less. Use the size-band ranges below to sanity-check your own indoor playground revenue and profit projections before you commit. All figures are in US dollars, and these are commonly reported ranges, not guarantees — your rent market and local demand will move them.
| Size band | Active play area | Annual revenue | EBITDA margin | Owner take-home (stabilized) |
|---|---|---|---|---|
| Small / play-cafe | under 2,000 sq ft | $180K–$300K | 12–20% | $40K–$90K |
| Mid-size | 2,000–6,000 sq ft | $400K–$900K | 18–25% | $90K–$200K |
| Large / FEC | 8,000+ sq ft | $900K–$2M+ | 20–28% | $200K–$500K+ |
Ranges from various industry financial models and operator-reported figures. One published five-year projection sees a large site doing $987K revenue and $327K Year-1 EBITDA; sector-level margins here are cross-checked against NYU Stern’s industry-margin dataset.
Two checks keep it honest: 1) A real-life small-site operator r/small business owner stated making only a “comfortable profit” with a snack bar. “My revenue was just over ‘$225,000,’“ they wrote. 2) Owners take home this much after multi-years; the seven-year veteran previously cited averaged $90K (years 1-4), then $150K (years 5-6), and finally $500K by year 7. The business model is sound; the timeline is patient.
The 9-Input Indoor Playground ROI Calculator
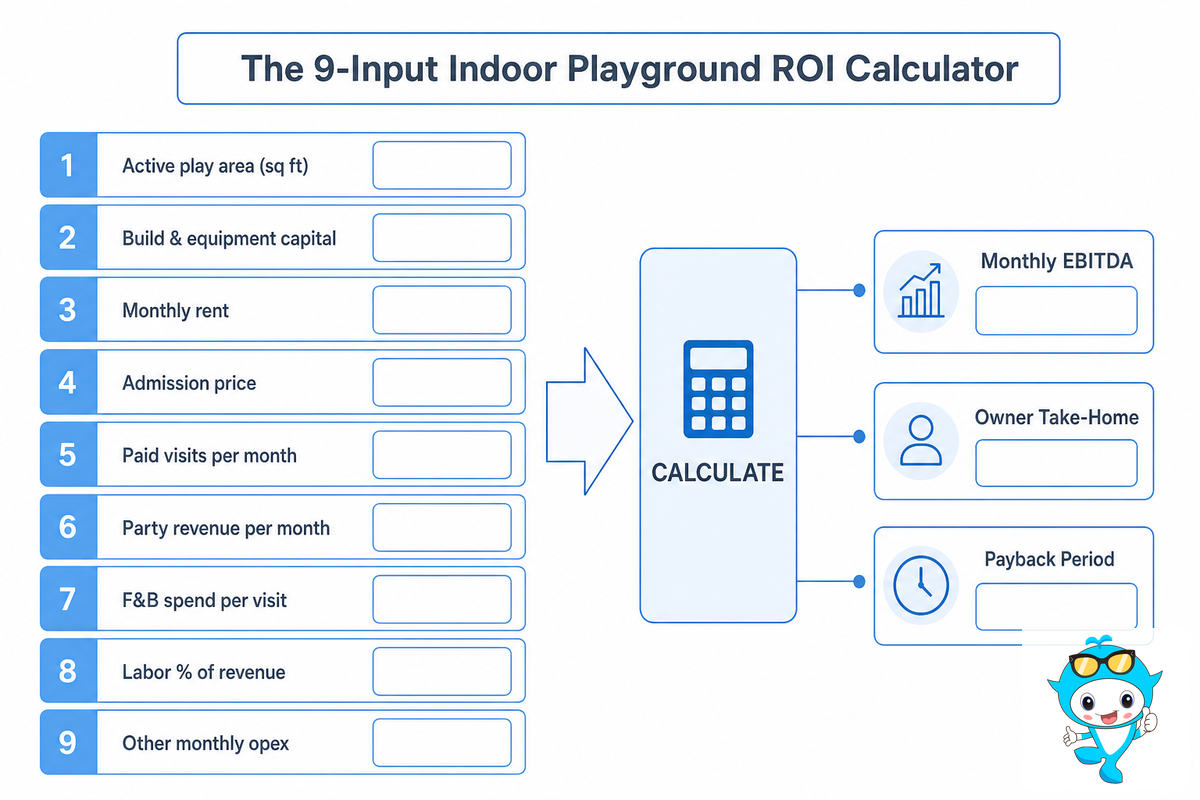
Here’s the page that never make it into the brochures: a free, plug-in calculator. Feed in nine inputs and The 9-Input Indoor Playground ROI Calculator returns your monthly EBITDA, your owner take-home, and your payback period. Best of all, if you want true, raw realism you can run the calculator a second time, at the level of your most conservative traffic projections – weekdays often won’t be Saturdays, and you must assume less than ideal occupancy from time to time.
| # | Input | Worked example |
|---|---|---|
| 1 | Active play area (sq ft) | 4,000 |
| 2 | All-in build & equipment capital | $300,000 |
| 3 | Monthly rent | $8,500 |
| 4 | Admission price (per child) | $15 |
| 5 | Average paid visits / month | 2,400 (~90/day) |
| 6 | Party revenue / month | $5,400 (12 × $450) |
| 7 | F&B spend / visit | $6 |
| 8 | Labor as % of revenue | 31% |
| 9 | Other monthly operating cost | $12,000 (insurance, HVAC, marketing, fees) |
Worked output. Revenue = admissions $36,000 + parties $5,400 + F&B $14,400 + memberships $1,200 ≈ $57,000/month (blended revenue per visit ~$24, in line with the ~$27.50 ARPV many operators target). Operating costs = payroll ~$17,700 + F&B cost of goods ~$7,200 + rent $8,500 + other $12,000 ≈ $44,500. Monthly EBITDA ≈ $12,500. Subtract a $3,500 loan payment and you have ~$9,000/month of owner cash before tax (~$108K/yr). The capital input (line 2) is where you plug in your equipment quote; for the full breakdown see our indoor playground startup-cost guide, and the soft-play structure itself — our commercial soft play equipment range runs roughly $8,000–$80,000 per kit by footprint and theme tier.
💡 Modeling Note
Run the calculator at line 5 set to about 70% of the foot traffic you are hoping for. If it still covers your loan payment plus a modest owner salary at that conservative number, the deal is real.
Break-Even Math: How Many Visitors a Day You Actually Need

It’s also where ‘if you build it and they’ll come’ business plans tend to die. Breakeven calculation depends on your contribution margin – and you must use reality, not wishful thinking.
📐 Break-Even Formula
Break-even paid visits / month = Fixed Costs ÷ (Revenue per visit − Variable cost per visit)
How long until an indoor playground breaks even?
A mid-size indoor playground breaks even at roughly 64 paid visitors a day. The logic is simple: once your per-visit contribution margin covers your fixed monthly cost, every visitor above that line is profit. Here is the worked calculation for our example site.
Fixed monthly costs — rent $8,500, insurance $1,500, utilities/HVAC $2,500, base payroll $10,000, and the $3,500 loan payment — total about $26,000. Blended revenue per visit is $24, and the variable cost per visit (hourly floor labor, F&B cost of goods, card fees) is roughly $9, leaving a $15 contribution margin per visit. Break-even = $26,000 ÷ $15 ≈ 1,733 paid visits a month, about 64 a day. Our example runs at about 90 a day, so it clears break-even with room to spare — but a site that plans for 90 and delivers 55 on a slow winter weekday is underwater for that stretch, which is part of why amusement and recreation ranks among the higher-failure sectors tracked by the BLS. A widely cited rule of thumb says your monthly rent should not exceed about 30% of gross revenue; cross that threshold and the visitor count you need to break even climbs out of reach.
Payback Period & ROI: When You Get Your Capital Back
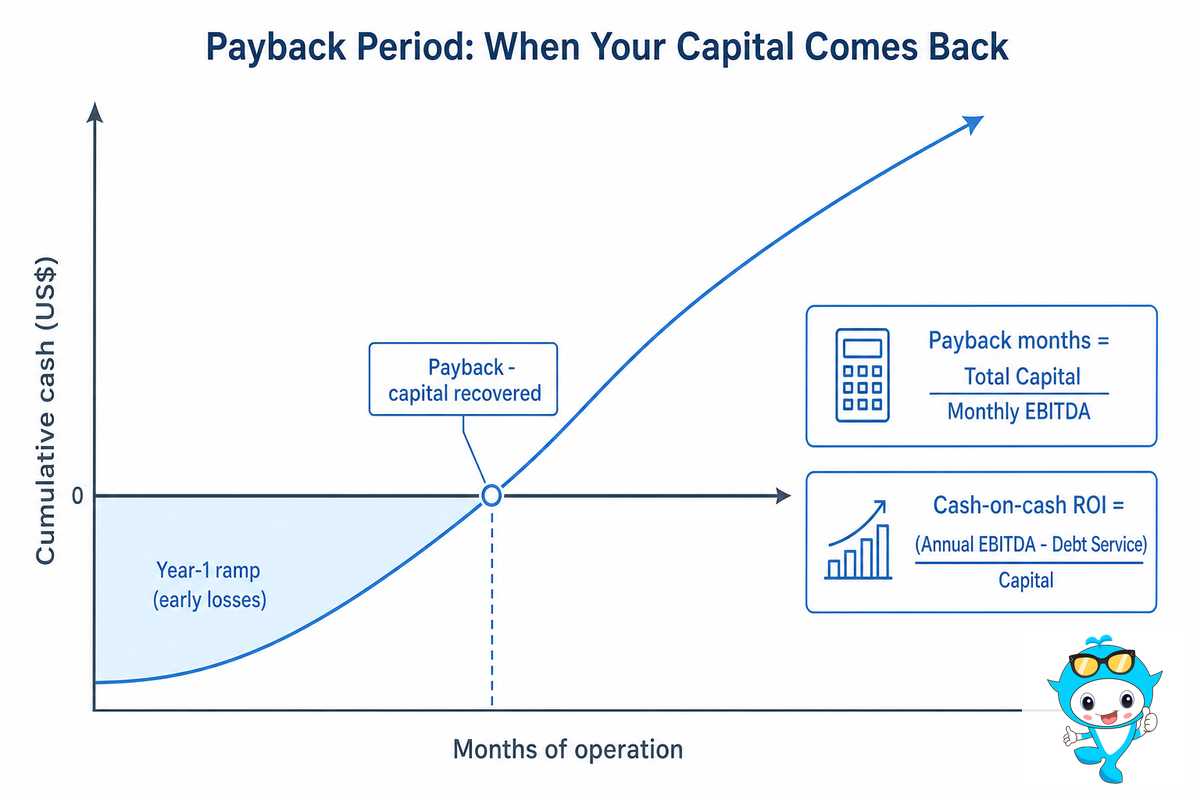
Above break even the next question to ask is how quickly the money that you’ve put in comes back. Two fairly simple formulas answer that:
📐 Payback & ROI
Payback (months) = Total capital ÷ Monthly EBITDA
Annual cash-on-cash ROI = (Annual EBITDA − debt service) ÷ Total capital invested
In the worked example, $300,000 of capital ÷ $12,500 monthly EBITDA ≈ 24 months. That figure is the basis of The 24-Month Payback Rule: If the worked payback exceed approximately 24 months, at your conservatively estimated (not your optimistic-case-best-case) occupancy level, the deal is on the edge – first make sure to run the levers described below before tying the knot. Picture two owners building the same 4,000 sq ft site: the one who holds capital to $300,000 and nets $12,500 a month recovers it in 24 months, while the one who over-builds to $450,000 and nets $9,000 is staring at 50 months — the same playground, a very different decision. In an A-plus location with little competition payback can come far faster; one operator reports having seen a two-month payback once, but called it “a true one-off, nothing special”.
Remember that payback is a prediction of where you *hope* you’ll end up, not a pledge of where you *will* land. The figure swings with how fast you ramp in year one; the early months are usually a loss while word of mouth builds, which is part of why a meaningful share of new sites never reach payback at all — BLS survival data shows roughly half of new establishments are gone by year five.
The 4 Profit Levers, Ranked by Dollar Impact
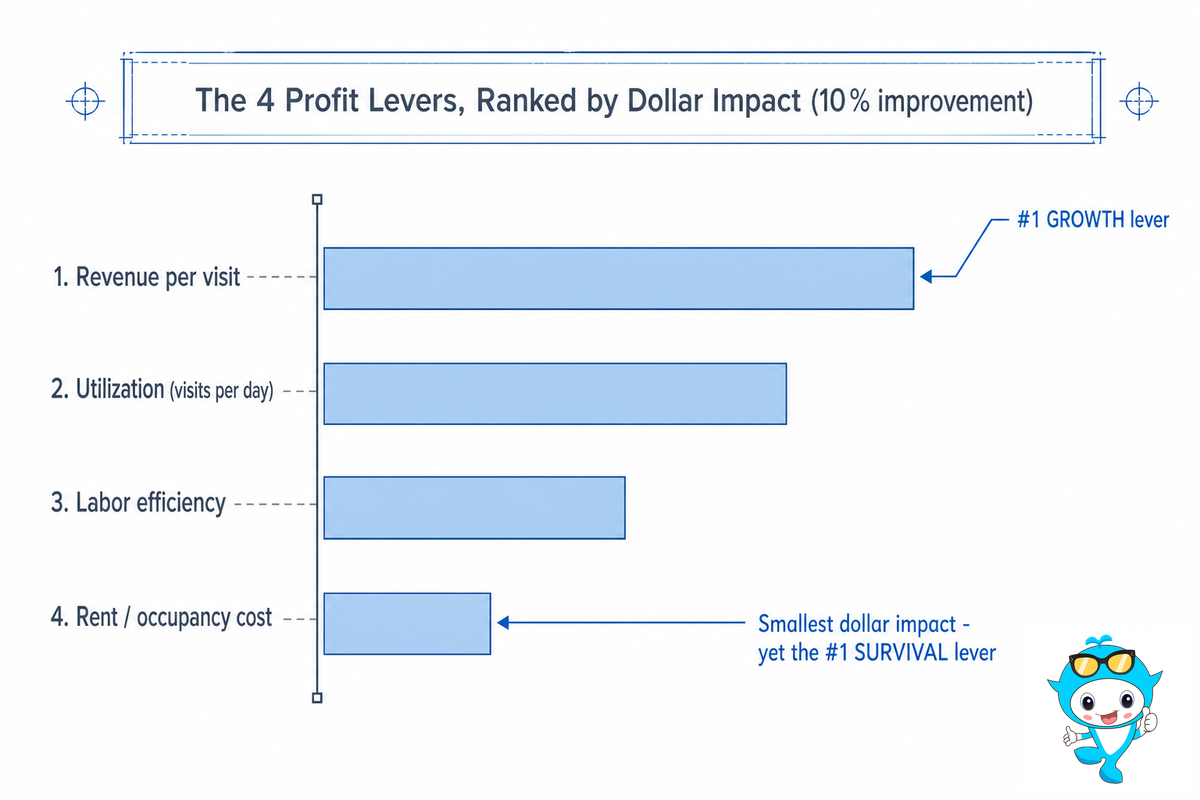
Most of the guides offer the “three factors.” I quantified them in the following exercise. I then take the for the worked example on a midsize site, I crank all of these levers at the 10% rate and take read EBITDA output and the ranking is usually not what owners expect to see, to the surprise of a large number of owners.
| Rank | Lever | A 10% improvement | Annual EBITDA impact |
|---|---|---|---|
| 1 | Revenue per visit (price + secondary spend) | +$2.40/visit | ~ +$55,000 |
| 2 | Utilization (visits per day) | +9 visits/day | ~ +$43,000 |
| 3 | Labor efficiency | −10% labor | ~ +$21,000 |
| 4 | Rent / occupancy cost | −10% rent | ~ +$10,000 |
The counter-intuitive finding: rent has the smallest dollar impact per 10% but is still #1 killer of indoor playgrounds. That is because the top two growth drivers are upside you can chase over time — raise party prices, add a café, fill weekday mornings with daycare field trips — while rent is a fixed cost locked in by a multi-year lease you usually cannot escape. While revenue per visit is your #1 growth driver, fixed cost is your #1 survival driver. Your fastest route to profit involves lifting blended revenue per visit through birthday parties and food and beverage, which an owner described as “economically immune to trends – every child has a birthday every year.” The fastest route to death is having rent that’s too high, above ~30% gross. Site specific caveat – In hot regions, HVAC costs and liability insurance can compete with rent to become the primary fixed cost, so model them as their own separate line item rather than an afterthought. For the five most common ways these levers go wrong, see the failure-mode section of our indoor playground ROI guide.
“Parents want Wi-Fi, younger kids want a play area, and everyone wants food and drink — think of these amenities as profit centers.”
— Athletic Business, recreation-facility trade press
FEC-Scale Economics: How Size Changes the Math
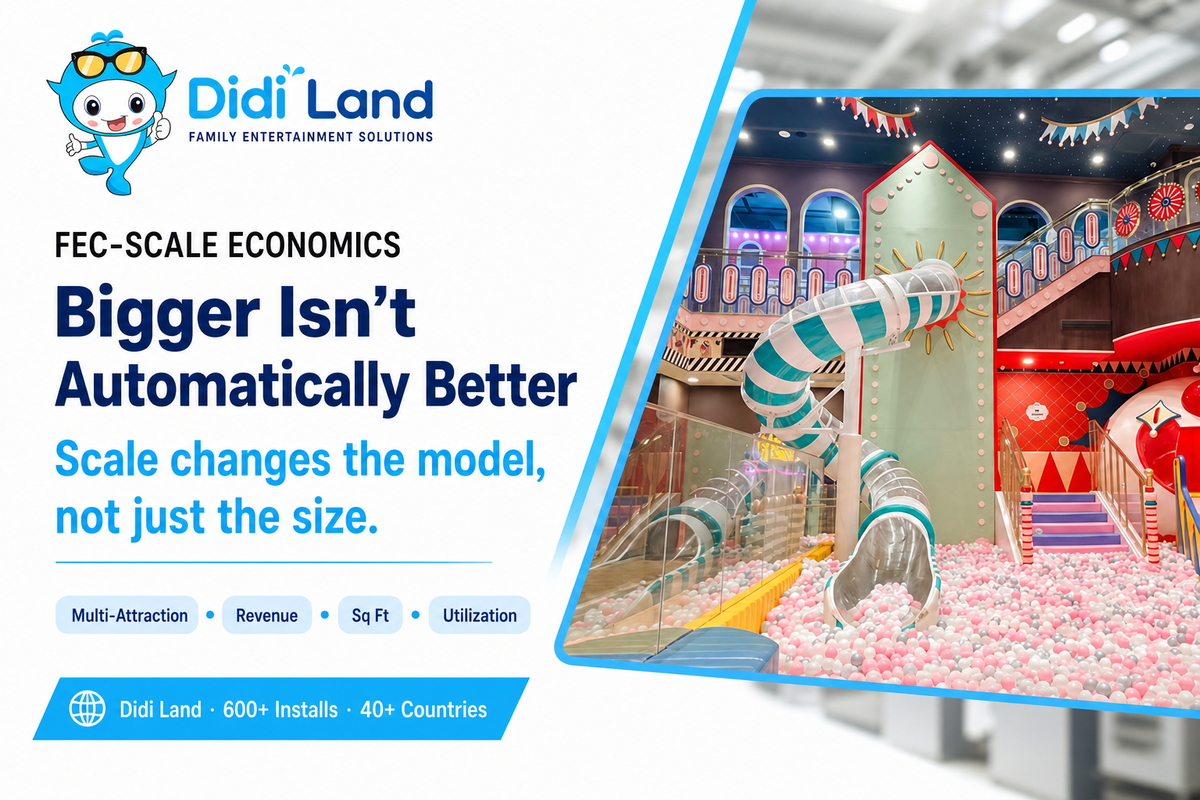
Scaling for family entertainment center owners means that the basic, small-site business model needs to change, not just multiply. An FEC layers multiple attractions (soft play, trampolines, arcade, party rooms, café) onto a much larger footprint. When the site is large, there will be higher initial fixed costs and cash outlay but the potential will be higher, particularly for filling revenue and the utilization of every square foot when the facility is running at capacity.
✔ What scale buys you
- Diversified revenue (parties + arcade + café smooth the weekday curse)
- Fixed-cost scaling: in one model, a 63% rise in visits lifted EBITDA 141%
- Higher revenue per square foot when utilization is high
⚠ What scale costs you
- Too large of an facility might not have as much revenue per square footage as smaller venues if it’s too often empty.
- The higher fixed rent costs-or the primary survival cost-have increased.
- More staff supervision and compliance overhead
The controversial idea to consider: size doesn’t always correlate with profitable because capacity constraints (i.e., limited safe density based on occupancy, with a recommended ratio of roughly 3 m² of active playing area per child) limit growth of an oversized facility faster than floor plan does. Typically, an oversizing the facility will cause you to use more fixed costs (i.e., rent costs) without having much increased capacity to accommodate customers. Generally, larger facilities “generate less revenue per square foot, so operating expenses are greater,” unless the visit volume increase at an appropriate pace. Based on our data with more than 600 projects across more than 40 countries for Didi Land, this hypothesis proves correct: while a 1500 m² facility in Mexico grossed roughly $120,000 per month, it did so as a result of its strategic combination of a large space and diverse attractions that achieve high utilization, not by virtue of its size alone. Check out our family entertainment center playground solutions and maps out the types of attractions suitable for different facility sizes if you’re considering a family entertainment center.
Industry Outlook: What’s Reshaping Indoor-Playground Profitability in 2026
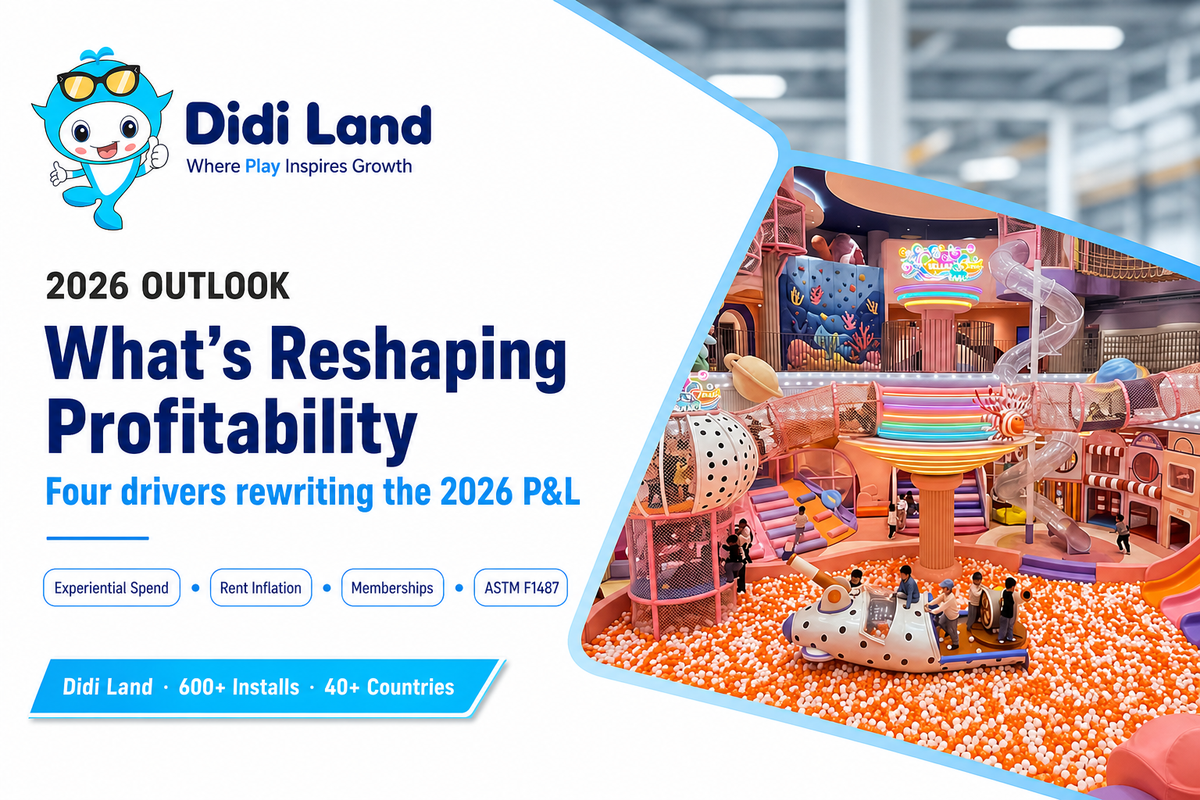
Four specific factors are poised to reshaped the industry in 2026, other than the “market is expanding” trend. When leading planning, it’s best to start with specific factors rather than broad market figures, such as market sizes of between $13 billion to $81 billion as estimates fluctuate depending on how a firm segments the industry.
- Experiential spending is migrating to your niche-parents are pulling budget from goods to experiences, which is great for attendance and party demand.
- Commercial rent inflation is pressuring #1 survival lever-higher occupancy costs will make sustaining a “under 30% of revenue” rent ceiling increasingly tough; model rent not on lease signing but upon renewal.
- Memberships and recurrences lift the cash-flow floor-operators are moving from per-visit tickets to memberships to smooth out the weekdays and build an EBITDA base.
- Safety standards raise the minimum capital floor-ASTM revised the public-use playground equipment specification (F1487) in 2025, and the CPSC updated its Public Playground Safety Handbook the same year.
One technical specification for budget control-soft contained play structure fall under ASTM F1918; while public use playground equipment fall under ASTM F1487-25, which *explicitly* does *not* cover soft-contained play. Building your model around conservative utilization assumptions and a rent price that survives renewal; then let memberships and parties be your upside, then your goal for 2026;
Frequently Asked Questions
Q: How much do indoor playground owners typically make?
View Answer
Owner take-home commonly runs from about $90,000 to $500,000 a year, scaling with footprint and how much of the work the owner does themselves. It is a ramp, not a starting figure: real operators report taking home around $90,000 in the first few years, then climbing past $150,000 toward $500,000 only once the site stabilizes and adds high-margin parties and food service. One published five-year model projects Year-1 EBITDA near $327,000 — but EBITDA is not take-home; subtract debt and your own salary to get the real number.
Q: How much does it cost to run an indoor playground each month?
View Answer
A medium size (4000 sf) center has average running expenses in the $40,000-$50,000 range; Top expenses are wages (often ~30% of revenue; US amusement and recreation attendants earn a median wage in the low-teens per hour), rent (target under 30% of gross), and utilities — HVAC for a large heated or cooled space surprises many owners. Add insurance, F&B cost of goods at about 50% of café revenue, marketing, and card-processing fees. Model these as separate lines so you can see which one is eating your margin.
Q: Is an indoor playground a better investment than a trampoline park or play café?
View Answer
This varies far less depending on layout of venue and more on labor/cap. A pay café needs less upfront capital while prioritizing the gross margin profit margin on F&B a trampoline park has far more space/injury costs and will also be associated with high premiums/risk. A soft contained play indoor playground will be balanced at around 4000 SF of space while catering to a younger market and strong birthday party revenue; Run all three through the same nine-input calculator and pick the format that clears break-even at conservative utilization in your specific rent market.
Q: Why do some indoor playgrounds fail to turn a profit?
View Answer
The most common cause is a lease that is too large or too expensive — rent above the ~30% ceiling that no visitor count can outrun. Underestimating utilities, insurance, and the year-one ramp follows close behind. See the full failure-mode breakdown in our indoor playground ROI guide.
Q: Can a small indoor play area out-earn a big FEC per square foot?
View Answer
Yes and no. A “thin and trim” 2,000 to 4,000sq ft play café or even FEC could easily beat an FEC that sits on 20,000sq ft on any day of the week in revenue per square foot and payback – if it has strong weekday utilization, can sell food well, and Party Packages to boot! Land size generally decreases the revenue per square foot unless there is significant throughput because the effective capacity of the building is dictated not by sheer size (as on average density will be safe-~3 square meters per kid) or HVAC systems but rather your local demand. An FEC typically captures dollars, a play café on the other hand, can capture an ROI in capital. Which choice is right for you will be based on who can make the numbers work out in your location – that’s why we developed this tool!
Q: How accurate is an ROI calculator before you sign a lease?
View Answer
1.
It is perfectly suitable for making this choice (whether to go or not to go to make the project) providing that inputs used are conservative. This tool is more precise for the estimation of expenses (rent, wages, insurance) and less precise for revenue and traffic forecasts-the 5 line has to be verified with 70% of its hope value before concluding the long term contract.
About This Analysis
The worked figures in this guide are illustrative, calibrated against US Bureau of Labor Statistics wage and survival data, published industry financial models, and Didi Land’s own pricing across 600+ commercial indoor-playground and soft-play installations in 40+ countries. They’re a starting model, not a forecast, your rent market, local wages, and demand will move the numbers. Reviewed by the Guangzhou Didi Land Amusement Equipment Co., Ltd. technical team.
References & Sources
- Establishment Age and Survival DataU.S. Bureau of Labor Statistics
- Amusement and Recreation Attendants, Occupational Employment & WagesU.S. Bureau of Labor Statistics
- Margins by Sector (Recreation)NYU Stern (Damodaran dataset)
- Public Playground Equipment & Safety HandbookU.S. Consumer Product Safety Commission
- ASTM F1487 / F1918 playground & soft-contained play standardsASTM International
- Revenue per square foot and unit sizeUrban Institute
Related Articles
3.
Thinking about creating an FEC or indoor playground? Click to get free layout design and the quote with equipment prices, directly export them into this calculator.
![Custom Dinosaur Playground Equipment [Design Guide]](https://didiplayarea.com/wp-content/uploads/2026/09/custom-dinosaur-playground-equipment-r2-featured-1-768x512.png)
![Custom Dinosaur Playground Equipment [Design Guide]](https://didiplayarea.com/wp-content/uploads/2026/09/custom-dinosaur-playground-equipment-r2-featured-1-150x150.png)