Get in Touch with Didi Land


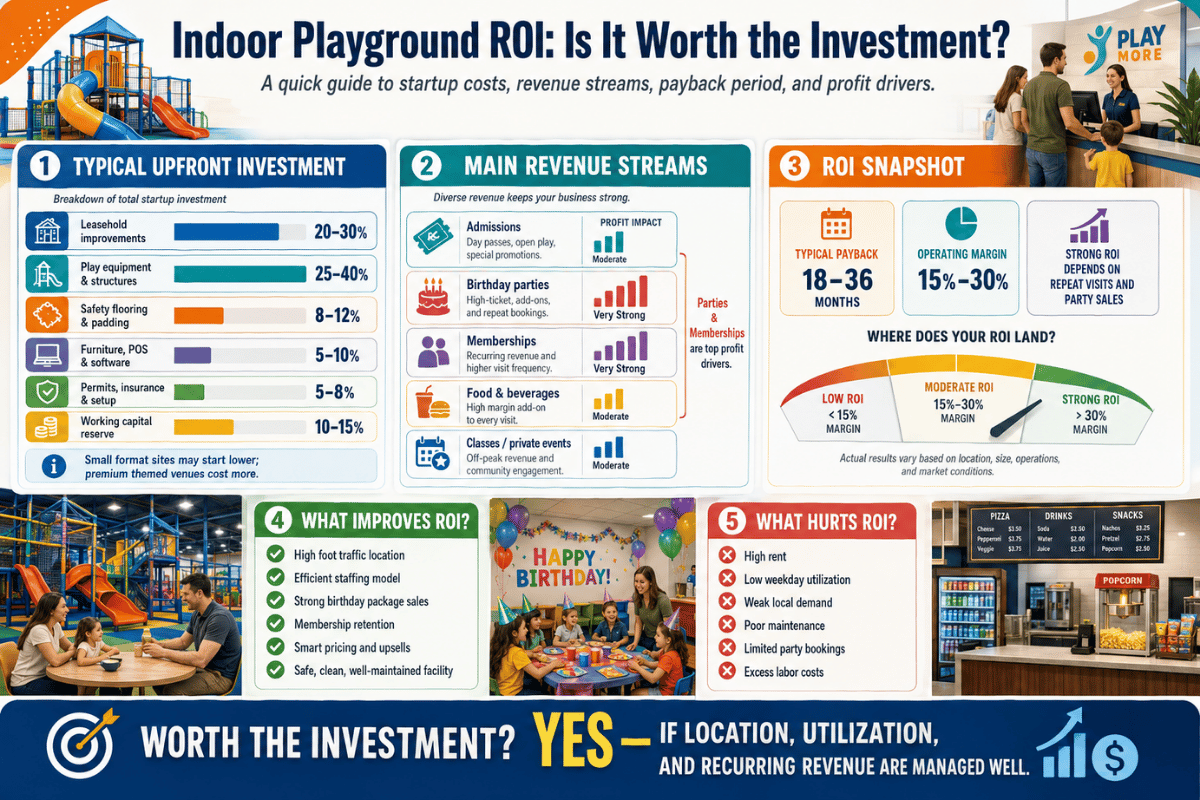
Quick Specs: Indoor Playground ROI at a Glance (2026)
| Realistic Annual ROI | 15–30% (well-managed) · 30–45% (top quartile) |
| Payback Period | 18–36 months typical · 12 months edge case |
| Net Profit Margin (mature ops) | 10–25% |
| Initial Investment | $50,000 (small play café) – $1M+ (large FEC) |
| Capacity Math | 3 sqm of active play area per child (max safe occupancy) |
| Failure Rate (3-year window) | ~30–50% (industry estimate, calibrated against BLS small-business data) |
| Industry Growth (2024–2030) | 8.1–13.9% CAGR globally |
Indoor Playground ROI by the Numbers
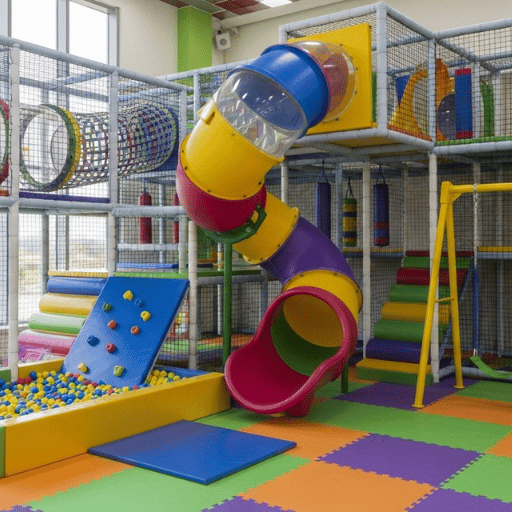
The general rule most prospective operators seek: a 5,000 sq ft commercial indoor playground in 2026 opening an indoor playground typically costs $150,000–$400,000 and produce an operating break-even in 3-6 months, recouping investment capital in 18-24 months with effective marketing execution. return on investment lands in the 30-40% range for the top performers. Undercapitalized operators with mismatched locations and weak weekday strategies never recoup the principal at all.
In our 600+ installations worldwide since 2014, we see the same payback distribution as the published figures: the top quartile recoups in 12–18 months on the back of strong birthday-party economics and disciplined rent ratios. Middle-tier operators average 24-36 months. Bottom-quartile operators stall indefinitely. What matters is not the average ROI — it is the delta between top 25% and bottom 25%, which is driven almost entirely by the operator’s ability to manage four levers: rent, capacity, revenue mix, and pre-opening marketing.
If you’d like a custom payback figure for your specific market and venue size, run your numbers through our indoor playground ROI payback calculator alongside the breakdown below — the calculator handles the math; this article handles the judgment.
What ROI Should You Actually Expect?
Search “indoor playground ROI” and you will find numbers that look like a typo. One supplier promises 70–200% annual return on investment. A second insists on 18–36 month payback at 30% margin. A third quotes 12 months. The variance is not because the industry is chaotic — it is because nobody is using the same definition.
That 70-200% ROI claim usually means the gross revenue equipment cost in year 1 – helpful for marketing but in full disregard of rent, wages, insurance, power and the 6-24 months of slow ramp-up pre-traffic. A 30-40% range better captures the closer approximation of net annual ROI based on capital investment, which is what your accountant or bank actually values. Twelve-month payback claims are real, but they require optimal conditions: stellar location, no competition, deliberate pre-opening marketing, and a launch correlated with holiday breaks.
Below is a side-by-side reading of what the major industry voices are actually saying – and how their figures measure up once you normalize the criteria.
| Source | Headline ROI / Payback | What it actually measures |
|---|---|---|
| Hanlin Playground | 30–40% annual ROI / 18–24 mo payback | Net annual return; full capital recovery |
| Weiroo Play (10-year operator voice) | 12–18 mo break-even (well-managed 500–1,000 sqm) | Capital recovery, not annual ROI |
| Angel Playground | 70–200% annual ROI | Gross revenue ÷ equipment cost (excludes rent/labor) |
| Dreamland Playground | 30–45% ROI / 18–36 mo payback | Operating margin (net of variable costs) |
| JAMMA (amusement industry revenue-stream focus) | 10–25% net margin target | Net operating margin after all costs |
| Industry KPI consensus (FinancialModelsLab) | 30%+ EBITDA margin, ARPV $27.50+ | EBITDA (excludes capex amortization) |
Realistic synthesis: budget for 15-30% net annual ROI, plan for 24 month payback and treat any number above 40% as either a gross-margin claim or a top-decile outlier (rather than a baseline expectation). trampoline parks – often bandied as the high-ROI cousin – show similar trends: faster headline payback (12-18 months in good locations) but much higher injury liability pushing insurance to a different cost class.
Startup Costs: What You’re Actually Investing
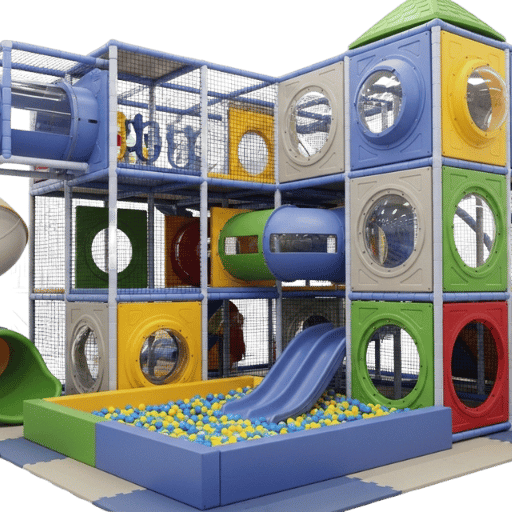
Total startup capital when starting an indoor playground in 2026 ranges from $50,000 for a modest play caf up to $1M+ for a 10,000+ sq ft Family Entertainment Center. Cost per square foot is the most useful planning lens: a turnkey indoor playground costs $15-$40 per sq ft for the play structure, safety flooring, professional installation and basic facility renovations. Use that range to size your capital ask before you begin serious lease negotiations.
| Facility Tier | Size | Total Budget | Equipment Share |
|---|---|---|---|
| Small Toddler Zone / Play Cafe | 2,500–5,000 sq ft | $50,000–$150,000 | $25,000–$60,000 |
| Medium Commercial Indoor Playground | 5,000–10,000 sq ft | $150,000–$400,000 | $80,000–$200,000 |
| Large Family Entertainment Center | 10,000+ sq ft | $650,000–$1,000,000+ | $260,000–$400,000+ |
Within the equipment line, the biggest driver is not sq ft – it is play density. Simple ball pits and slides run $100-$150 per sqm; a multi-level play structure with mechanical spinners, donut slides and interactive projection elements can double that. Custom soft play sets, themed zones and certified climbing equipment all fall higher on the curve. Use our indoor-play-structures/cost-tier-calculator”>cost tier calculator to map your venue variables to a budget tier and recommended product series.
Beyond the play structure, plan for four other capex line items that consistently blindside first-time operators:
- Equipment costs (the play structure itself): 30-50% of total budget — usually the largest single line item.
- Safety flooring: EVA foam mats are priced at $1.50-$3.00 per sq ft; commercial PVC padding in the region of $4.00-$7.00 per sq ft. That price gap reflects critical fall-height performance, not aesthetics.
- Shipping + professional installation: 15-25% of equipment cost. Most commercial play structures ship in 40-foot containers; equipment costs include freight from overseas factories; certified installers are not optional for ASTM/EN-compliant commercial playground assembly.
- HVAC upgrades: $10,000-$50,000. Retail-grade air conditioning cannot handle 50-200 active children plus accompanying parents; expect to upsize the unit and add ventilation.
- Lease deposit + legal: 3-6 months base rent as security deposit; $3,000-$7,000 for lease attorney review (especially when a Triple Net lease).
📐 Engineering Note — Certified equipment carries a 15–25% premium for a reason
Equipment certified to ASTM F1487-25 (the 2025 revision of the U.S. consumer-safety performance specification for public playground equipment), EN 1176 (European), or AS 4685.1 (Australian) costs 15-25% more upfront than uncertified soft play areas. That premium pays back through (1) lower commercial general liability premiums – insurers underwrite certified facilities differently, (2) quicker municipal permitting in markets that audit for compliance and (3) much lower likelihood of a single injury claim triggering a 30-100% premium hike at renewal. Check that your supplier’s compliance documentation is post-2025-revision, not legacy F1487-21 or earlier – the new standard updated impact criteria, signage and supervisor-hazard guidance in accordance with the CPSC Public Playground Safety Handbook (2025 update). Run your spec through our ASTM / EN 1176 compliance screening tool before you sign the supplier.
If you are weighing supplier options, see how factory-direct sourcing of indoor play structures and soft play equipment compares to franchise-approved-vendor pricing — covered in detail in the franchise section below.
Revenue Streams: How Indoor Playgrounds Actually Make Money
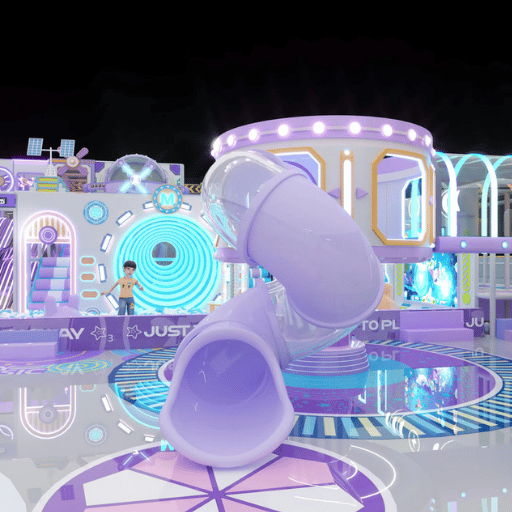
A profitable indoor play area is not dependent on ticket price and ticket sales alone — successful indoor amusement and indoor play spaces stack 5–7 income sources. Economics work because the same square footage and the same staff are able to generate 5-7 different revenue streams, each with it’s own margin profile. Below is a typical range of revenue-mix seen from well-managed operators—the sort of mix that should form the basis of your business plan from day one.
| Revenue Stream | % of Gross Revenue | Notes |
|---|---|---|
| Walk-in admissions (income sources) | 25–40% | $8–$35 ticket price per child depending on market |
| Birthday parties & private events | 15–30% | $300–$800 per package; pre-booked weeks ahead |
| Food & beverage (café) | 10–20% | 60–75% high-margin returns if menu is tight |
| Memberships & passes | 5–15% | $25–$50/month; predictable recurring cash flow |
| Attractions & arcade (VR, simulators) | 8–20% | $3–$8 per play; differentiates premium tier |
| Retail (socks, branded merch) | 3–8% | Mandatory grip socks carry 400%+ markup |
| Corporate rentals / school field trips | 2–10% | Drives weekday foot traffic |
Which Revenue Stream Offers the Highest ROI?
Honest answer: it depends on which definition you use. Two of the most prominent industry sources give very different numbers for birthday-party profit ability: one supplier pegs party packages at 60-80% margin; the other pegs them at 20-40%. Both are “correct”—they measure different things. That 60-80% number is gross margin (price minus pizza, supplies, and the dedicated party-room cost). That 20-40% number is net margin after allocating party-host labor, F&B fully-loaded cost, and the opportunity cost of reserving the party room.
For a functioning operator, the practical hierarchy by net contribution per square foot of play area is: (1) birthday parties, (2) F&B, (3) memberships, (4) walk-in admissions, (5) retail (high per-unit margin but low volume). Parties are successful not because the margin is the greatest—the F&B wins on gross margin—but because they monetize otherwise-empty time slots and attain pre-booked revenue regardless of weather or weekday traffic.
Revenue Mix Template by Facility Size
- 200-500 sqm (mall/restaurant kiosk): 70% admission 20% party 10% F&B
- 500-1,000 sqm (standalone entry-level FEC): 45% admission 25% party 15% membership 15% F&B
- 1,000+ sqm (full FEC): 35% admission 25% party 20% membership 15% F&B 5% retail/sponsorship
A 5,000 sq ft (~465 sqm) indoor play area functioning at a typical mix at $8 average ticket, 180 visits/day, 15 parties/month at $350 average, and a modest caf will generate approximately $69,000-$72,000 monthly gross profit. After deductng rent (target under 30% of gross—see the failure modes section), payroll at 20-35% of revenue, utilities, insurance, and supplies, a healthy operator makes around 10-25% net margin. Operating the same square footage on only ticket income without parties or F&B would not be feasible.
In planning for a Family Entertainment Center with multiple revenue sources, our soft play FEC ROI calculator provides the multi-stream analysis—and the indoor playground for family entertainment centers layout demonstrates how positioning influences upsell capture.
Franchise vs Independent: Which Path Yields Better ROI?
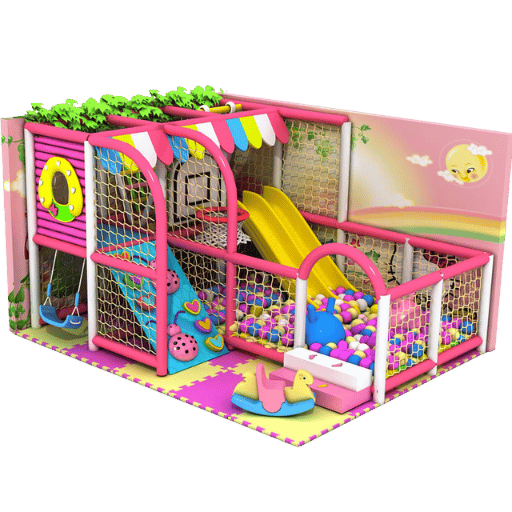
An independent indoor playground installation is generally less costly than a franchise, but the difference is narrower than the headline numbers imply once you include brand recognition, operating standards, and supply-chain bargaining advantage. Franchisees avoid the $30,000-$60,000 initial franchise fee and the 6-8% royalty on gross—significant sums over a ten-year lease period. Trade-off: independents develop the operations manual independently and bear the marketing expenses that a franchise system would have previously amortized.
Is Franchising a Good Way to Scale an Indoor Playground?
From a single-unit operator perspective, franchising seldom provide significant value for total ROI – the royalty drag (6-8% gross sales = 25-40% of typical margin) usually sucks the profit away faster than the value of the brand and playbook. Franchising makes more sense when you target 3+ units and want a packaged consistent systems to scale-up at. Don’t forget, one or two company-operated sites for validation before you franchize would lower-than-necessary franchise fragility cost. Here is 2026 headline numbers for three of the most cited indoor-playground franchisors.
| Cost Category | Franchise (typical) | Independent | Impact on ROI |
|---|---|---|---|
| Initial fee | $30,000–$60,000 (Pump It Up $30K, Luv 2 Play $35K+) | $0 | Pushes payback 3–6 months later |
| Total project cost | $600,000–$2.5M (Luv 2 Play range) | $50K–$1M+ (your discretion) | Franchise typically locks in larger build |
| Ongoing royalty | 6–8% of gross sales | 0% | Eats 25–40% of net profit |
| Ad / marketing fund | 2–3% of gross (Luv 2 Play 3%, Pump It Up 2%) | Variable (your choice) | Mandatory regardless of local need |
| Approved-vendor markup | 20–30% above factory-direct | 0% | Hidden tax on every capex line |
| Brand recognition | Yes (regional) | Build from zero | Saves 6–12 months of marketing ramp |
| Operations playbook | Provided | Build it yourself | Real value for first-time operators |
| Equipment supplier choice | Locked-in | Free choice | Independents save 20% via factory-direct |
A note on franchise survival data: SBA general statistics on business loans show roughly 50% of small businesses survive 5 years, and franchised systems “reduce specific risk” through standardized operations – but indoor-playground-specific franchise vs independent failure-rate data is not publicly broken out. Treat franchise survival as an unverified premium, not a guarantee buffer. If you are ranking an alternative venue type – restaurants, hotels, mall kiosks – our hospitality ROI calculator covers similar economics for play-as-amenity formats.
The Hidden Costs (Insurance, HVAC, Maintenance) That Sink ROI
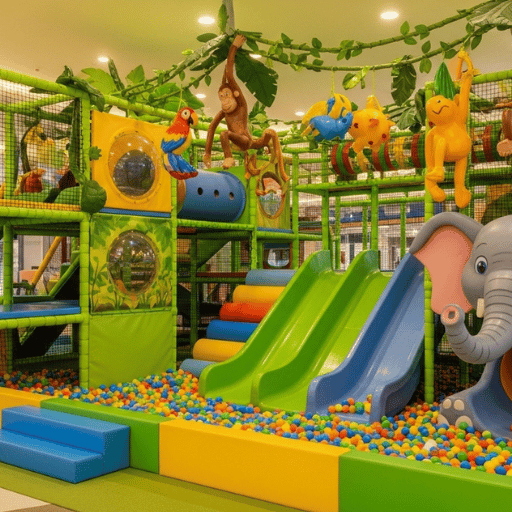
First time operators systematically get the play-structure budget (CPE), we basically miss everything else. Hidden line items below are not exotic – these are the ones every spreadsheet leaves blank or slots in a placeholder dollar figure that later turns out to be 2-3x too low.
| Hidden Cost | Annual Range | Driver |
|---|---|---|
| Commercial General Liability insurance | $5,000–$12,000 | Recreation/amusement classification + claim history |
| Insurance costs — Workers’ Compensation | $2,000–$8,000 | Mandatory; varies by state and headcount |
| Property Insurance | $2,500–$6,000 | Equipment value + building coverage |
| HVAC operating cost | $8,000–$30,000+ per year | Climate; high-load summer months |
| Maintenance costs (equipment) | 5–10% of equipment value/year | Daily netting checks, ball-pit sanitation, vinyl repair |
| Pre-opening marketing | 5–8% of total capital | Local social ads, school partnerships, party pre-sales |
Here is a real world comparison: in a Reddit discussion, a Would-be-compani80p operator was computing his math system-out-loud and calculated $3,400/month in-party revenue by assuming $425 party package, 1 party/day – but had not yet included the labor cost of the host, the child-ball pit cleaning cycle, or the extent of cafe-revenue cannibalization. Forum participants with hands-on operating experience flagged exactly the hidden cost categories above — equipment costs, maintenance costs, insurance costs — as the silent ROI killers. Lesson: every cost element that appears to be overhead is actually, in indoor playgrounds, a direct margin killer. Insurance Information Institute CGL premium figures confirm recreation classifications underwrite at 1.5-2x standard retail pricing.
⚠️ Top 5 Due Diligence Items Before Signing the Lease
- Rent escalator: cap annual increases at 3% not “market rate”
- Triple Net (NNN) carve-outs: if so, bootstrap property tax, structural/maintenance insurance, and building function costs into your monthly burn
- HVAC tonnage: pull utility bills from previous tenant; determine optimized furnace size if necessary
- Parking demand: 1 space/3 children at peak; note local competition for parking by Saturday lunch
- ADA compliance for play structures: forces for accessibility drive transfer, sensory zones
Why 30–50% of Indoor Playgrounds Fail Within 3 Years
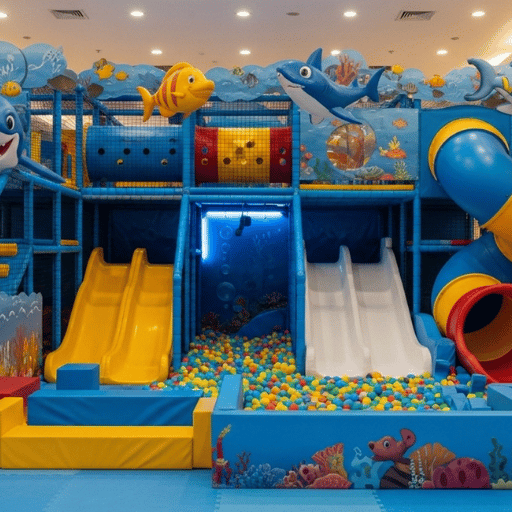
US Dept of Labor BLS establishment life expectancy and survival metrics indicate nearly 50% of all private-sector SMEs go out of business within 5 years in most sectors. As you move deep into recreation fields/amusement, your discipline is not magically immune – and in our 600+ Didi deployments across 40+ nations, we find recreation/amusement operators tend to fail shortly earlier than BLS averages, a frustrated majority of failures occurring in the months 12-36 phase after launch when capital expenditures is trailing off and revenue patterns have become structural. We believe industry-based estimates have 3-year abandonment at 30-50% for indoor playgrounds calibrated against general small-business sampling data and our operator interviews across SCORE and SBA case studies.
“Industry math says 18-36 month payback. Reality says: 30-50% of operators never get there.” The mathematics fail for several predictable, named reasons – five of them, all within the operator’s control prior to signing the lease.
Failure Mode 1: The Rent Trap
The single biggest point of failure. A 30% Rent Rule — credited to operator Leo Xin (Weiroo Play) but referenced by the majority of experienced operators – states that monthly rent should never surpass 30% of monthly gross sales. When crossing >40% you are instead working for the landlord. Trap is psychological: a prime mall location at 35% rent seems more secure than a tier-2 location at 22%, but the mathematics show the latter is consistently more profitable once revenue stagnates.
Failure Mode 2: Capacity Mismatch
Designed for peak weekend through put but run mid-week dead zones. A 3 sqm-per-child capacity formula gives a peak occupancy, not a sustainable one. Running revenue sustainable means implementing weekly-market tactics – school venture trips, parent-and-toddler clubs, weekday special discount hours – to fill in the structurally vacant critical-hours.
Failure Mode 3: The Insurance Cliff
A single injury report – many times when settled – becomes the probability driver for a 30-100% premium escalation at renewal, plus increased deductibles. Operators who under-provision their equipment to save $20,000 upfront may pay twice that rate in premium hikes subsequent to the initial incident. ASTM F1487-25 and EN 1176-compatible equipment is safer – it is also what your insurer is always underwriting against.
Failure Mode 4: Seasonal Cash Burn
Summer revenue drops by 15-35% through out most sectors when families travel and outdoor venues cannibalize. Affordability to Rotorup and utilities is unaffected. Operators lacking 3-6 months of operational cashflow buffer ($75,000-$150,000 for a typical 50,000 sq ft facility) cede the August cash-flow squeeze before the September back-toschool rebound.
Failure Mode 5: Equipment Underspec
Purchasing non-certified or sub-spec equipment to compress capex by 20-25%. Those dollar share shortages are undone the minute one safety claim causes a forced shutdown awaiting inspection, an insurance claim spike, or worse, local-government license review. ASTM F1487 was revised in 2025; the new version tightened impact standards – equipment certified to the prior version is increasingly disadvantaged in insurance underwriting.
If you are serving either kindergarten or daycare clients specifically, our indoor playground for kindergartens guide and the kindergarten funding eligibility estimator address the additional municipal-compliance layer that retail-only operators do not face.
Having looked at dozens of indoor playground businesses I have identified three factors that seem to be most important to the success of this business type. Those operators that recognize all three before signing a lease are the business who breaks even within 24 months – where those who miss even one rarely reach year 3.
— Michele Caruana, Profitable Play Podcast (300+ episodes on indoor playground operations)
The Worth-It Decision Score: Is Indoor Playground ROI Right for You?
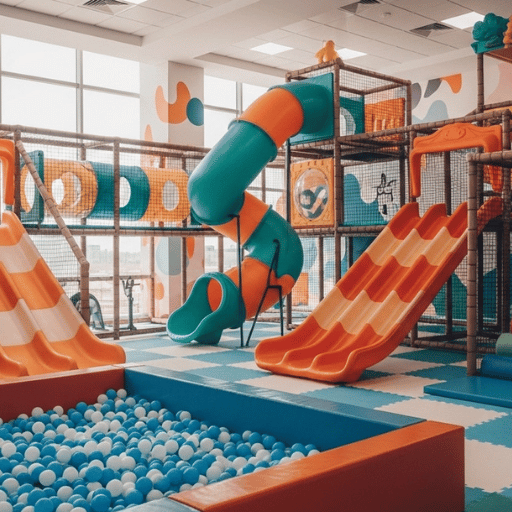
This 30-50% failure rate is not random – it maps almost perfectly to the signing readiness of the operator. Worth-It Decision Score below scores ten conditions into four categories. Greater than 16.
OK to proceed. Between 10 and 15. Seal the gaps before moving forward.
Less than 10. Walk away (or pivot with a lower-capex format e.g. a play-cafe partnership or kindergarten supply contract).
The Worth-It Decision Score (10 criteria, 0–20 points)
Score each criterion 0 (no), 1 (partial), or 2 (yes). Total honestly. Calificación en honestidad.
- Market – Local catchment density of demand: 5,000+ children under 12 within a 10 mile radius (0-2)
- Market – Competitive whitespace: Less than 2 competing FECs in 10 miles (0-2)
- Market – Demographics income: Median household income within the county (0-2)
- Capital – Liquid capital 1.3est. startup: cushion for over runs (0-2)
- Capital — 12-month operating reserve: Beyond startup capex (0–2)
- Eq, capital – under 60% of loan to cost ratio: no crushing debt service cash flow (0-2)
- Operations — Hospitality or retail experience: 3+ years (0–2)
- Operations -Temps dedicar: Prêt 60+ heures par semaine au cours de la première année (0-2)
- Risk – same 18 month zero revenue: If one business remains in operation (1- 2) household still covers.
- Risk – Partner/spouse agreement: Both were on board with the timeframe and risk (0-2)
16–20: GREEN — Proceed. Your fundamentals support a normal-distribution outcome (15–30% ROI, 18–36 month payback).
10–15: YELLOW — Close the gaps before committing. Whichever criterion scores lowest is your biggest single point of failure.
0–9: RED — Don’t invest. Consider lower-capex alternatives: kindergarten equipment supply, hospitality play-amenity, mall pop-up programs.
Most potential operators say blindly that they will fall in the 11-14 range on first honest pass. Most common failure mode: putting in too much money on equipment (high score) and too little money on operating reserve (zero score). Run the score before you write the check for the lease deposit.
Industry Outlook 2026: Where the Amusement & FEC Industry Is Heading

The macro picture for indoor playground investment in 2026 is positive. Multiple market-research firms put the global Family/Indoor Entertainment Center market at $45–46 billion in 2026, growing to $76 billion by 2030 at 13.9% CAGR per Research and Markets. U.S.-specific FEC market sits at $5.25 billion (2024) and projects $10.56 billion by 2034 at 8.1% CAGR per Allied Market Research, while IBISWorld pegs U.S. arcade/food/entertainment complexes at $6.0 billion in 2025. Even at the lower end of the forecast range, the macro tailwind is real.
Three structural shifts shape the 2026 entry window:
- Post-pandemic demand persistence. Parents continue to trade screen time for indoor active play; weather-independent venues are no longer a niche category. Repeat-visit metric across most operators is up 10–20% versus 2019 baselines.
- Tech-upgrade cycle. Interactive projection games, AR play modules, and hybrid VR-soft-play installations are pulling into the mainstream. Per Jammapark industry data, a single VR attraction can lift average revenue per visit (ARPV) by 10–30% in well-placed installations. Themed environments — see indoor playground themes & custom design for candy / jungle / ocean / space configurations — are also pulling premium pricing.
- Regulatory tightening. ASTM F1487-25 and July 2025 CPSC Public Playground Safety Handbook updates strengthened impact criteria, signage, and trainer-supervisor-hazard guide lines. 2026 operators should preemptively specify F1487-25 approval; legacy F1487-21 spec sheets are increasingly disadvantaged during insurance underwriting and municipal permitting.
Pragmatically, a Q3 2026 lease runs 18-24 months lead time—build-out, general hiring, pre-marketing—before early Christmas 2027. That window, combined with the strongest take-off period if you earned at least a 16+ Worth-It Decision Score, should maximize the first-run opportunity in Tier-2&3 suburban malls—these locations are where the majority of retail anchors are vacating during the early-2020s.
Frequently Asked Questions
Q: What is a “good” profit margin for an indoor playground in 2026?
View Answer
An acceptable net profit margin is usually 10-25% for experienced, mature operations. Less than 10% signals inefficiency, excessive rent, or a concentration in the local market. Greater than 30% is can be uncommon, with the exception that it doesn’t include capex amortization or the full load of labor. Look for EBITDA margin of greater than 30% as a more sustainable metric.
Q: How long does it take to break even?
View Answer
Most new centers will operate efficiently (monthly revenue exceeds monthly costs) within 3-6 months. It takes 18-36 months for solid design-build to reach capital recovery (your total profits from this module equal your initial investment). A 30% Rent Rule and aggressive birthday-party pre-sales are the most reliable speed catalyst.
Q: Should I lease or buy the playground equipment?
View Answer
Operate those facilities if cash flow is a current problem and you wish to market into the target local area for 24 months prior to committing to a purchase agreement. Buy those centers if long-term (4-5+ years) viability can be expected—most equipment depreciates over seven-to-ten years in the modest zone, and well over 80% of the factory-direct factory-sealed best rated equipment maintains residual resale value. Many American franchise operators amortize their equipment via Small Business Administration loans, which provides capital, without having to cash-out on the purchase.
Q: How does facility size affect ROI?
View Answer
200-500 sqm. Dedicating to the module produces the quickest return-on-investment period (~12-24 months), but it limits overall revenue generated in the first few years. 500-1,000 sqm is the long-road investment—initial results are long, but follows the range as the best-sized facility for first-time operators; larger 1,000+ sqm Family Entertainment Centers will achieve the largest dollar ROI, but take longer to reach break-even (24-36+ months) requiring operating discipline of multi-revenue stream models. The indoor jungle gym-level module selector maps location size to proposed equipment series.
Q: What insurance do I actually need?
View Answer
A specialized ‘amusement and Recreation’ Commercial General Liability policy at $1M-$5M limits is the norm, along with Professional Workers’ Compensation, Equipment-contents Property limit coverage and additional Umbrella pollution limits of greater than a million dollars if trampolineos or similar level-of-risk features will be utilized. Generic small-business liability policies are inadequate–find an agent who writes recreation exposures and consult Insurance Industry Institute commercial product-lines for general limits of coverage.
References & Sources
- Establishment Age and Survival Data — U.S. Bureau of Labor Statistics
- Public Playground Safety Handbook (2025 update) — U.S. Consumer Product Safety Commission
- Notice of Availability: Public Playground Safety Handbook Update — Federal Register
- Standard Lines Premiums: Commercial General Liability — Insurance Information Institute
- 2024 Small Business Profile — U.S. Small Business Administration, Office of Advocacy
- Economic Impact Studies — International Association of Amusement Parks and Attractions (IAAPA)
- ASTM Publishes Revised Consumer Safety Performance Specification (F1487-25) — SGS Safeguards Bulletin
- Arcade, Food & Entertainment Complexes in the US — Market Size — IBISWorld
About This Analysis
The cost ranges, payback timelines, and revenue-mix benchmarks in this article are calibrated against 600+ Didi installations across 40+ countries since 2014, cross-referenced with published industry data and the BLS / SBA establishment survival baselines. Where the numbers diverge from the bullish 70–200% ROI claims you will find on competing supplier sites, we cite the methodology gap directly. Reviewed by Didi engineering team — 12 years of factory-direct manufacturing experience, certified to EN 1176, AS 4685.1, ASTM F381-16, CE, and ISO 9001:2015.
![Custom Dinosaur Playground Equipment [Design Guide]](https://didiplayarea.com/wp-content/uploads/2026/09/custom-dinosaur-playground-equipment-r2-featured-1-768x512.png)
![Custom Dinosaur Playground Equipment [Design Guide]](https://didiplayarea.com/wp-content/uploads/2026/09/custom-dinosaur-playground-equipment-r2-featured-1-150x150.png)