Get in Touch with Didi Land

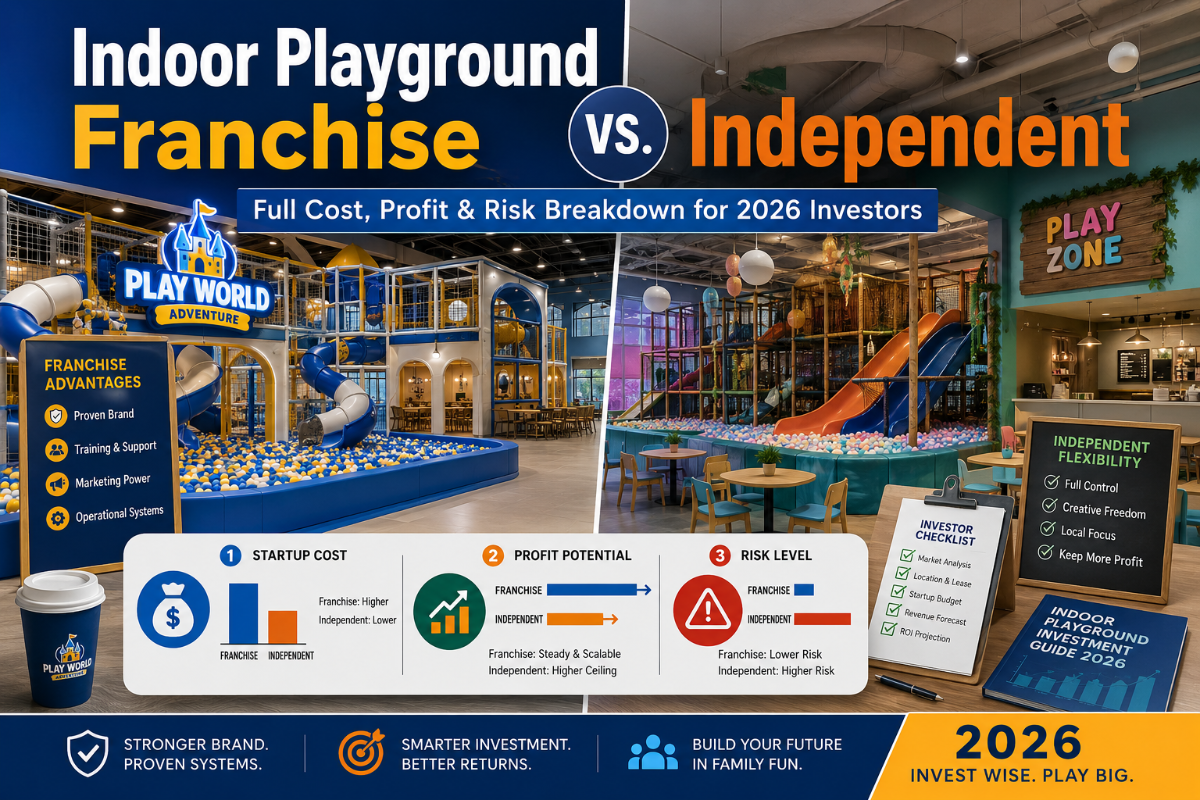
If you are comparing indoor playground franchise vs independent ownership as your next indoor playground business (via Luv 2 Play, PlayPalz or other franchise) in 2026, the decision is rarely about logos or aesthetics. It is a math problem layered over regulatory, operational and market-fit choices. Most franchise sales pages will show you the initial franchise fee and what each franchise offers in turnkey support. They will not reflect the 5 year-run royalty drag, the FDD Item 20 closure data, or the corporate-approval bottlenecks that determine if your park is profitable.This decision guide cross-references active Franchise Disclosure Documents from Luv 2 Play and PlayPalz, FDD Item 20 closure data across 424 franchise brands, the FTC Franchise Rule (16 CFR Part 436), the CPSC 2025 Public Playground Safety Handbook, and IAAPA / Research and Markets 2026 family-entertainment-center forecasts. The decision tree at the end converts the data into a recommendation matched to your capital, experience and market size.
Indoor Playground Franchise vs Independent at a Glance
Quick Specs
| Capital required | Franchise: $250K–$2.5M total | Independent: $150K–$500K (lean) to $700K+ (themed) |
| Upfront franchise fee | $30K–$60K (most brands) or up to $150K+ for premium concepts | Independent: $0 |
| Recurring royalty + ad fund | 6–8% royalty + 1–3% marketing fund of gross sales | Independent: 0% |
| Time to open | Franchise: 6–12 months with corporate workflow | Independent: 6–14 months self-managed |
| Brand recognition | Strong only for mature multi-state chains; minimal benefit for sub-10-unit franchises |
| Creative + operational control | Franchise: low (brand standards binding) | Independent: full control of pricing, programming, build-out |
Bottom line: an independent path keeps the 9–11% ongoing fee that a franchise deducts from your top line. A franchise path provides templated systems and (sometimes) brand pull. Both can succeed. Neither is universally better. What follows in this guide quantifies which compromises matter for your specific circumstance.
Total Cost of Ownership: Franchise Fee, Royalties, and Build-Out
Buyers focus on the franchise fee. FDD-disclosed figures tell a different story: the ongoing royalty almost always dwarfs the initial franchise fee. To determine your start-up costs for the same 5-year time horizon, consider both.
| Cost Line (5,000 sq ft park, $400K Year-1 revenue) | Franchise Path | Independent Path |
|---|---|---|
| Upfront franchise fee | $40,000 | $0 |
| Build-out + equipment | $220,000–$320,000 (vendor-locked supply chain often runs 20–40% above factory-direct rates) | $170,000–$250,000 (factory-direct equipment, regional contractor) |
| Royalty (6% on gross, Years 1–5) | $24,000 × 5 = $120,000+ | $0 |
| Advertising fund (3% on gross, Years 1–5) | $12,000 × 5 = $60,000 | Self-allocated marketing budget (often 4–6% of revenue, but spent locally) |
| 5-Year Total (excl. rent + labor) | ~$440,000–$540,000 | ~$170,000–$250,000 |
The royalty math is what most franchisees overlook. At a 6-7% royalty on $400,000 of annual revenue, you deposit roughly $24,000-$28,000 to corporate every year. Within 14 to 18 months at typical revenue, your total royalty disbursement surpasses the upfront franchise fee itself. Industry references often mention a 24-to-36-month crossover; the cross-referenced FDD arithmetic suggests it occurs sooner.
💡 The 3-Year Royalty Tax
A simple perspective for prospective franchisees: At a 6% royalty on $400,000 in annual revenue, you wire $24,000 per year to corporate — $72,000 across three years. That sum is more than the majority of upfront franchise fees in this category. An independent owner directs that same $72,000 toward inventory, local marketing, or the down payment on a second facility. This is not a critique of the franchise business model — it is the recurring arithmetic the brochure omits.
Build-out is the second cost trap. Franchise brochures often cite $150,000-$200,000 in fit-out costs assuming a new retail shell. In the real world, leased space often requires fire sprinklers, ADA-friendly restrooms, second egress routes, and Type-1 kitchen hoods if you sell hot food. Industry analyst Michele Caruana chronicles one play-café franchisee whose franchise budget of $180,000 ballooned to $330,000 – a 60-80% overrun borne entirely by the franchisee. If you’re estimating build-out from a franchise proposal, include a 30% contingency for permitting and code-compliance scope creep.
Want to cross-check your equipment-line budget against your own footprint? Run your sketch through our indoor playground equipment cost-tier calculator before requesting a franchise proposal — it gives you a factory-direct baseline to compare against.
Profitability Reality Check: Monthly Revenue, Margins, and Payback
Owner income references run wild in forums and franchise sales pages. They also vary enormously depending on territory, footprint, and revenue mix. Honest framing: any single number is misleading without comparables. Figures below are industry-aggregated ranges, not a guarantee for any one facility.
Is owning an indoor playground profitable?
Yes – for indoor-play small business owners who cap fixed costs and run a high-utilization weekend schedule. Industry-aggregated reports place owner take-home in the $150,000-$500,000 annual range for a 5K-8K sq ft established facility, with EBITDA builds from roughly $327,000 in Year 1 to $787,000 by Year 5 for models that attain utilization targets. Real-life Reddit conversations among owners show that just party revenues can produce $400,000+ annually if the venue runs six $300 parties across Saturday and Sunday. The catch: rent must stay below 30% of monthly gross revenue, labor below 25%, or the model collapses, franchise vs independent notwithstanding.
Recurring-fee math reshapes the income picture sharply. An independent owner posting $400,000 in revenue keeps around 18–22% as net (after rent, labor, supplies, insurance). Under a franchise model with 9% combined royalty plus ad fund, that same revenue leaves 9–13% net — roughly half. That is the price of the franchise system. Whether it is worth paying hinges on whether that system actually drives enough incremental revenue to compensate.
10–12%
Net profit margin under typical 8% royalty + ad fund
18–22%
Net profit margin for well-run independent operators
30%
Maximum rent share of monthly revenue (above this, the model breaks)
If you desire a more detailed payback model customized to your specific market, run your figures through our indoor playground ROI payback calculator – it enables you to tweak franchise royalty rates and revenue assumptions to see once and for all when the difference pays back.
“Because royalties are based on gross revenue, franchisors make money even if you don’t. For many franchisees, this results in a weekly takehome below $3,000 while working 50-60 hours weekly.”
— Michele Caruana, M.A. Economics, Founder of Play Café Academy and Play Maker Society
Brand Power vs. Creative Control: What You Trade Off

The franchise marketing pitch relies heavily on brand recognition. However, it is also the least supported claim with data in the indoor-play sector. Indoor play is a hyper-local business. Parents in a 5-mile range decide based on cleanliness, party packages costs, and online reviews – not franchise branding. Commercial franchise brands only draw truly assured traffic in mature, multi-system, marketing-funded chains. For emerging franchises with less than 10 units, the brand value is only psychological for the owner, not behavioral for the customer.
✔ What franchise brand power actually delivers
- Faster opening-week traffic if the chain is known regionally
- National media-buy economies for digital ads
- Pre-built party-package templates families recognize
- Reduced “first venue” trust hurdle
⚠ What it costs you
- No menu, programming, or pricing experiments without corporate approval
- Locked-in POS, booking, and waiver software
- Mandatory sourcing from approved suppliers
- National marketing schedules that may not sync with your area school calendars
⚠️ Common mistake
Indoor-play message boards detail operators who paid for “certain promotion” only to find their ad fund plans went toward recruiting franchisees, not responding traffic. Insist on line-item list of how ad fund dollars are spent locally versus nationally or in franchise-recruiting channels.
Operational Support: Training, Marketing, POS, and Supplier Networks

Franchisors charge royalties because they bundle a support stack. A natural follow-up: which components of that stack can you not replicate through capital, labor, and know-how at less than 9% of top-line sales? Most can be replicated. A few cannot.
| Support category | Franchise deliverable | Independent equivalent |
|---|---|---|
| Site selection | Demographic fit + lease support | Hire a retail tenant rep ($0 to franchisee — broker fee paid by landlord) |
| POS + ticketing software | Locked-in vendor (often legacy) | SaaS platforms (Roller, CenterEdge, Intercard) at ~$200–$400/month |
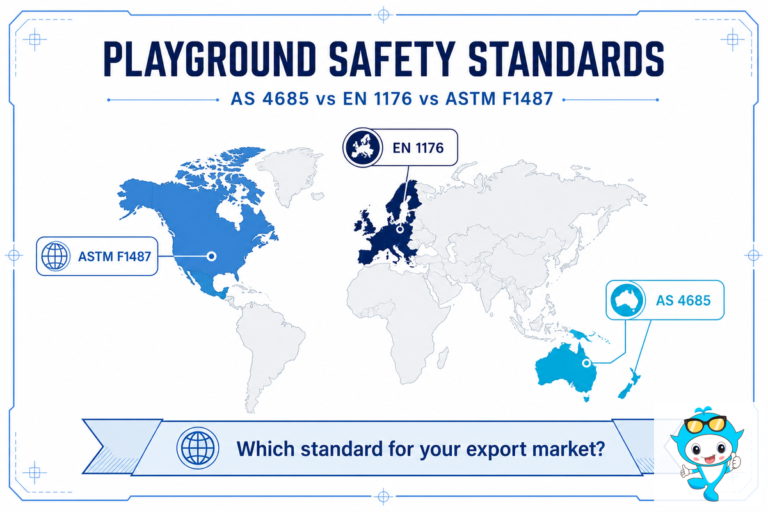
| Equipment supplier | Approved-vendor list | Direct from a certified manufacturer; verify ASTM F1487 / F2373 compliance |
| Operating manuals + training | Pre-built SOPs, staff-training modules | Buy a play-business operations course or hire a consultant for 4–6 weeks |
| National marketing | Mandatory ad-fund contribution | Local Google + Meta ads at 4–6% of revenue (better local-intent ROI) |
| Insurance + compliance | Group policy access | IAAPA member rates; broker who specializes in family-entertainment risk |
📐 Engineering Note
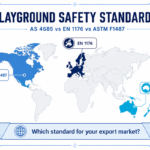
No matter your path – franchise or independent – every indoor soft-play architecture component must conform to ASTM F1918 (soft-contained play equipment for children 6 months to 12 years) and indoor-applicable ASTM F2373 mandates. Verify these with CPSC Public Playground Safety Handbook (2025 edition) fall zone, head entrapment and protrusions prior to factory shipment. Always ask franchisors and factories for third-party certifications (IPEMA, TÜV) before signing with a partner – uninsurable equipment is the kiss of death in most U.S. insurance policies.
One dimension a franchise structure cannot replicate on an ongoing basis: the softness & design flexibility of the commercial soft-play equipment that you specify directly with manufacturers. Independents can select density and themes optimized for their market, franchises often are left with a generic ‘brand standard’ not optimized to the local market.
Top Indoor Playground and Soft Play Franchise Brands in 2026
If a franchise is the right path for you, the next step is a brand shortlist. Below is a representative sample of the most active brands currently in the market — treat it as a starting point for FDD comparisons, not a standalone recommendation.
| Brand | Total investment | Franchise fee | Royalty + ad fund | Footprint signal |
|---|---|---|---|---|
| Luv 2 Play | $600,000–$2,500,000 | Disclosed in FDD on request | 6% royalty + 3% advertising | FEC + café format; multiple US + Canada units |
| PlayPalz | $407,500–$1,634,000 | $40,000 (single unit) | 6% royalty + 3% advertising | Established 2022; 2 units total (1 corporate + 1 franchised). Early-stage system. |
| Goldfish Swim School (adjacent benchmark) | $1,660,000–$3,750,000 | Per FDD | Per FDD | 177 units; 0% annual closure rate per FDD Item 20 — included as a maturity benchmark, not direct competition |
| Mid-tier playground / soft-play emerging brands | $250,000–$700,000 | $30,000–$50,000 typical | 5–8% royalty + 1–2% advertising | Highly variable — verify unit count and FDD Item 20 carefully |
The Goldfish Swim School row is included for an important reason. According to FDD Item 20 closure data analyzed across 424 franchise brands, the entertainment category averages a 4.6% annual closure rate while education-and-tutoring averages 6.0% — but mature children’s chains like Goldfish post 0% closures across 177 units. The important conclusion: it does not matter whether your franchise is 1 unit or 50 — scale and maturity are more predictive of closure than franchise compared to independent status. A 50-unit franchise with 10 years of FDDs and Item 19 financials disclosed presents a different risk profile than a 2-unit franchise still refining their operating procedures.
💡 Selection criterion
Before engaging a franchise system, ensure that you ask three points: (1) How many units have operated for more than 36 months? (2) Is Item 19 financial-performance information disclosed; and does it include labor and rent? (3) What has been the Item 20 closure/transfer trend over the last three years? Affiliates that refuse to answer is already taking themselves out of your consideration set.
Open an Indoor Playground Without a Franchise: 9-Step Roadmap

If your analysis supports the independent path, your process is well-traveled but procedurally heavy. Step sequencing below maps to a 6-to-14-month opening timeline depending on permitting speed and equipment delivery in your city.
- ✔
Step 1 — Market study (Weeks 1–3). 5-mile radius household income, child-density, weekend traffic patterns, competing indoor playgrounds and trampoline parks. Match footprint to demand: 3,000 sq ft for under-100K population markets, 5,000–8,000+ for 250K-plus.
- ✔
Step 2 — Business plan + funding (Weeks 4–8). Lenders evaluate creditworthiness and projections, not your franchise affiliation. A solid playground business plan plus a professional equipment quote and a realistic startup budget is highly persuasive to SBA 7(a) lenders.
- ✔
Step 3 — Site + lease (Weeks 6–12). Use a tenant rep. Verify zoning for “indoor recreation” and check sprinkler, occupancy, and ADA-restroom status before signing.
- ✔
Step 4 — Equipment specification (Weeks 8–14). Request 2–3 quotes from certified manufacturers. Verify commercial indoor playground equipment meets current ASTM F1918 / F2373 compliance and IPEMA certification before signing the purchase order.
- ✔
Step 5 — Theme and branding (Weeks 10–16). Independent operators win on theming customization. Consider a custom themed indoor playground design rather than off-the-shelf — themed parks command 20–30% higher party-package pricing in most markets.
- ✔
Step 6 — Permitting + build-out (Weeks 14–24). Sprinklers, second egress, ADA restrooms, and Type-1 hood (if you serve hot food) are the line items most likely to overrun. Budget 30% contingency.
- ✔
Step 7 — POS, booking, waiver, insurance (Weeks 22–28). Set up Roller / CenterEdge / Intercard, integrate digital waivers, secure $1M+ general liability coverage with an FEC-experienced broker.
- ✔
Step 8 — Hire and train (Weeks 24–30). Plan for 8–12 part-time staff per 5,000 sq ft venue. Build party-host SOPs and safety-supervisor checklists before opening.
- ✔
Step 9 — Soft launch + grand opening (Weeks 28–36). Run a 2-weekend friends-and-family soft open before publicizing. Capture feedback, fix flow issues, then drive opening weekend with local Google + Meta ads.
📐 Engineering Note
Insurance companies will not bind insurance coverage unless they have ASTM-compliant equipment and a third-party safety inspection of the final assembled structure. Include this step in Step 6 (post installation, pre-opening). Avoiding this step is the number one cause of delayed openings for independent soft-play operators.
Legal Fine Print: FDD, Royalties, and Exit Clauses
When reviewing a potential franchise, the Franchise Disclosure Document (FDD) is most informative piece of paperwork you will review. Most of the heavy lifting is done by federal regulations – you just have to know what to look for.
What is a Franchise Disclosure Document (FDD)?
The FDD is a federally mandated disclosure that franchisors must provide to prospective franchisees under the FTC Franchise Rule (16 CFR Part 436). It lists 23 specifics, covering everything from the franchisor’s litigation history through the financial performance of existing units. According to the FTC Consumer Guide to Buying a Franchise, you must receive the FDD at least 14 days before you sign any contract or pay any money to the franchisor. That 14-day window is your read-and-due-diligence period — use it.
⚠️ Five FDD items to read first
- Item 5 — Initial fees. The exact franchise fee, training fee, and any other one-time payments.
- Item 6 — Other fees. Royalty, ad fund, transfer fees, technology fees, audit and renewal fees. This is where the 9–11% recurring figure lives.
- Item 7 — Estimated initial investment. Watch for unrealistically low build-out estimates that assume new retail shells.
- Item 19 — Financial performance representations. If a franchisor refuses to disclose Item 19 data, you cannot evaluate whether the system actually generates the revenue needed to cover royalties.
- Item 20 — Outlets and franchisee information. Three years of opening, closure, and transfer history. Also lists current franchisee contact information so you can speak to former owners.
Speak with past franchisees listed in the Item 20 list — not just current owners the franchisor introduces you to. Ask why they exited, how long it took to break even, and whether corporate support matched what was promised. Combine that with the published Item 20 closure-rate data for a far more accurate assessment than any sales call will provide.
Decision Framework: Which Path Fits Your Situation?

Is it better to own a franchise or your own business?
It makes more sense to match the path to the operator profile. A single operator can be right for a franchise in one market and right for an independent in another. Below is a matrix that ties together three variables that decide it: capital availability, business-management experience, and local market density.
| Investor profile | Capital | Experience | Market | Recommendation |
|---|---|---|---|---|
| Conservative First-Timer | < $300K | First business | < 100K population | Independent path, smaller (3,000 sq ft) footprint, lease-back equipment to limit downside |
| De-Risk Buyer | $300K–$700K | First business | 100–250K population | Mid-tier franchise IF the system is mature (10+ units, 36+ month average tenure, Item 19 disclosed) |
| Growth Operator | $400K–$700K | 1+ businesses owned | 100–250K population | Independent + custom theming; license or franchise out later as you scale to second location |
| Multi-Unit Aggregator | > $700K | Multi-unit experience | > 250K population | Master franchise rights with a mature chain OR multi-unit independent rollout |
Assuming second stores are critical and operating experience is the most important factor, the three operator profiles where independent paths are most convincingly superior are: markets with small populations and no existing brand awareness, growth-oriented operators planning a second location, and any buyer for an early-stage franchise (sub-10 units, less than 36 months of operating history). The franchise path wins when turnkey systems are required and the system may be purchased with more than 50 operating units and available Item 19 disclosures.
If you want a working session to go through your own capital, footprint, and market — including a custom layout sketch — talk to our project team. We have helped operators in 40+ countries spec out independent builds and have a calibrated sense of where the franchise-vs-independent math actually lands per market.
Industry Outlook: What’s Changing for Indoor Playgrounds in 2026

The market context for any indoor-playground decision in 2026 is unusually favorable on the demand side and tightening on the operational side. Three signals worth pricing into your decision:
- Demand: Family/indoor entertainment market on a 13.9% CAGR. Per the Family/Indoor Entertainment Centers Market Report 2026, the global FEC market is valued at $45.61 billion in 2026 and projected to reach $76.68 billion by 2030. The IAAPA Family Entertainment Centers tracking confirms ongoing post-pandemic recovery and rising weekend visit frequency. Translation: demand-side tailwind for both franchise and independent operators in markets where supply has not yet saturated.
- Regulation: CPSC and FDD enforcement both tightening. The Public Playground Safety Handbook 2025 edition — published July 2025 — refreshes fall-zone, head-entrapment, and surfacing requirements that flow into the indoor-applicable ASTM F2373 framework. On the franchising side, 2025 saw stepped-up state-level FDD enforcement with per-incident penalties up to $11,820 plus possible criminal liability for non-compliance. Both signals push toward better-documented compliance for any operator entering in 2026.
- Format: Modular, low-maintenance, social-first attractions winning share. Industry trend reports for 2026 highlight a shift toward modular soft-play structures (faster reconfiguration, lower long-run maintenance) and “social-first” design (Instagram-friendly photo moments). Independent operators capture this trend more easily than franchisees because they can iterate the build without corporate approval cycles.
Action implication: If you intend to open in 2026, start your FDD review or independent equipment-specification process by Q3 — opening timelines from contract to grand-open run 6 to 14 months. Operators who wait until 2027 to begin will be opening into a more saturated competitive set.
Frequently Asked Questions
Q: Is an indoor playground franchise profitable?
View Answer
While franchises can often be profitable for operators that mesh the franchise model with a viable local market, the standard 6-8% royalty as a percentage of gross, plus 1-3% advertising fund contribution generally yields headlines telling a story of 10-12% net margins on gross vs. 18-22% for successful independents. Franchises work when the brand can drive incremental revenue that exceeds the royalty costs (more consistent across multi-state mature systems vs. emerging brands with fewer than 10 units).
Q: How much does it cost to open an indoor playground franchise vs independent?
View Answer
Indoor playground franchise total investment lands between $250,000 for emerging brands and $2.5 million for top-tier FEC formats. Independent build-outs run $150,000–$700,000 depending on footprint and theming. Headline cost difference is the upfront franchise fee ($30,000–$60,000 typical) — but a larger long-term cost is the recurring 6–8% royalty plus 1–3% advertising fund, which compounds across the contract term.
Q: What is the typical royalty for an indoor playground franchise?
View Answer
Most indoor playground and family-entertainment franchises (including all those I studied) typically charge 6-8% royalty against gross sales, in addition to 1-3% of a national advertising fund. Both Luv 2 Play and PlayPalz are public with 6% royalty + 3% advertising fund. Your royalty is against revenue (not profit) – so pay this whether or not your venue is profitable.
Q: Can I get financing without a franchise brand?
View Answer
Yes. SBA 7(a) lenders and equipment-finance houses review your business plan, personal credit, and cash-flow forecasts – they do not care if you have a franchise affiliation. A well-written plan combined with a professional equipment quote from an accredited manufacturer is compelling to underwriters. Independent operators regularly obtain SBA-backed loans for $300K-$700K projects with no affiliate brand.
Q: What is a Franchise Disclosure Document (FDD)?
View Answer
FTC also regulates this disclosure document is required of franchisors must provide to potential franchisees. The franchise disclosure document is a required government release sent to prospective franchisees 14 days prior to signing an agreement or requesting payment of any money. It lists 23 items including franchise fees, financial performance representations, litigation history and current franchisee contacts. Of those 23 items, items 5, 6, 7, 19, and 20 are the most important areas of the disclosure to study.
Q: Can I franchise my own indoor playground later?
View Answer
Considering starting a franchise? There is a distinct advantage to opting for an independent start-up first: your published successful concept will be working across two to three locations long before you consider franchising (including the required FDD registration in each state) or licensing the concept. Building a proprietary brand up front preserves that optionality, whereas executing into someone else’s franchise typically precludes it.
Q: Is there a $10,000 indoor playground franchise option?
View Answer
Is this true? Total investment in any active indoor playground franchise begins at an estimated $250,000 with equipment, build-out, and working capital, however, an order of magnitude lower entry (approximately $10K-$50K of investment) to the indoor-play business is considered a mobile soft-play rental operation, not a traditional brick-and-mortar indoor playground.
Q: How much do indoor playground owners make per month?
View Answer
Take-home varies by region, footprint, and revenue mix. Industry-aggregated reporting places monthly owner take-home in the range of $1,000–$25,000+ for established 5,000–8,000 sq ft venues, with the upper end concentrated in higher-density markets and party-revenue-heavy operations. Monthly take-home well below this range usually signals rent above 30% of gross or labor above 25% — both red flags worth fixing before scaling.
Q: Can I buy playground equipment wholesale or factory-direct instead of through a franchise?
View Answer
Yes — this is exactly the independent path. Franchise systems bundle equipment sourcing, design, and brand into one royalty-bearing package; going independent means you can buy soft play and indoor playground equipment directly wholesale from a certified manufacturer at factory pricing, with your own custom theming, and skip the recurring 6-8% royalty entirely. The trade-off is you also lose the franchise’s turnkey site-selection support and brand recognition, so budget more time for your own market research and marketing plan.
Ready to model your specific opening cost?
Run your market, sized by foot traffic measurement, along with your themed concept to our free calculator to receive a standard manufactured-equipment cost tier estimate before requesting your franchise quote.
About This Analysis
This article was composed by the Didi Land project and design team — manufacturers of certified indoor playground and soft play equipment since 2014, serving operators in 40+ countries. Cost, royalty, and ASTM compliance figures are cross-checked against active 2025–2026 Franchise Disclosure Documents and federal guidance from the FTC and CPSC. Reviewed by Didi Land design and project engineering team.
References & Sources
- Franchise Rule (16 CFR Part 436) — Federal Trade Commission
- A Consumer’s Guide to Buying a Franchise — Federal Trade Commission
- Public Playground Safety Handbook (2025 edition) — U.S. Consumer Product Safety Commission
- Family Entertainment Centers — International Association of Amusement Parks and Attractions (IAAPA)
- Family/Indoor Entertainment Centers Market Report 2026 — Research and Markets
- Franchise Failure Rates by Industry — 2026 FDD Item 20 Data — Franchise Breakdown
- PlayPalz Indoor Playground — Franchise Cost & Requirements — International Franchise Professionals Group (IFPG)
- Luv 2 Play — Franchise Opportunity — Franchisor disclosure page
- Read This BEFORE Joining A Play Cafe Franchise Program — Michele Caruana, Founder, Play Café Academy
Related Articles
- Indoor playground for family entertainment centers — Equipment, layouts, and ROI signals for FEC operators
- FEC soft play ROI calculator — Model your soft-play return profile by attraction mix
- ASTM and EN 1176 indoor playground compliance checker — Verify your equipment specs against current standards
- Mall-based indoor playground formats — Specifications and traffic profiles for shopping mall venues